Over the last year or so, I've been blogging mainly from the
Work Foundation site. This would seem to be an appropriate time to mirror these posts on this site, all in one go. Formatting will be untidy and links to source material won't appear as they did in the original (Work Foundation) posts, but if you see something interesting and want to know more I'm sure you'll be able to find your way via the Work Foundation site.
March Director's report
17 March 2015
Much of the recent media commentary on technological progress foments fear. Barely a week passes without a new story about robots stealing our jobs. These
scaremongering stories miss the point that the nature of the work that we do has always evolved over time - our jobs will not be stolen, but they will
inevitably morph. For sure, our education and HR development systems need to be fleet of foot in order to react to the changing needs of the labour market.
But we should remember that, where they are adopted, new technologies will, generally speaking, come to the fore because they improve things for us. After
all, technological developments are human constructions; we have a choice.
Indeed, far from being a threat, the problem with technology in recent years - in the UK at least - has been that it has advanced far too slowly.
Between 2006 and 2011, the number of UK patent applications fell by some 15%. Over the same period, business enterprise investment in research and
development rose 9% from £16.4 billion to £17.8 billion (in 2012 prices); this followed a 3% real increase over the preceeding 5 years. While patent
numbers are a crude guide to the value of innovation, these data suggest something of a decline in the returns to investment in R&D. There is, of
course, a long literature, including the work of Zvi Griliches, Bronwyn Hall and others, pointing to a long term fall in the return to investment in
R&D in the US, and more recent studies have addressed similar issues in the UK, albeit for the period before the Great Recession. For the period
since, some evidence comes from NESTA's innovation index- which sums the percentage changes in all forms of private intangible capital and total factor
productivity. After a long period of growth, this fell by 2.0% in 2008 and by 6.8% in 2009, and has barely been positive since.
Business investment more generally has been identified by some observers as a key factor explaining the sluggishness of productivity. This is indeed likely
to be an important factor; from its peak in the second quarter of 2008, real terms business investment fell by almost 20% over the course of seven
quarters, and a subsequent partial recovery stalled in 2012. In late 2013 and early 2014 it recovered again, at one point rising at an annual rate of more
than 10%. But business investment has slid back over the last couple of quarters. The median forecast for business investment growth in 2015 now stands at
5.6% - down from the 2014 figure of 8.1%.
Measures designed to provide a healthy framework in which investment, and particularly successful investment in R&D, is encouraged include the
strengthening of patent protection and fostering of product market competition. Ensuring that firms with strong capacity to innovate have access to finance
is key, and promoting this is likely to require new instruments and methods for evaluating companies' stocks of intangibles.
While the productivity puzzle remains a conundrum largely because there is in truth a plethora of underlying causes, ensuring that the policy framework is
one that encourages successful innovation is likely to reap a high dividend in this arena. It is reassuring to note that this has come to be high on the
political agenda. For the longer term, as well as for fixing the short term issue, this will need to be a priority for the next government.
A bit more evidence on pay below the Living Wage
23 February 2015
The TUC has released an instructive analysis of low pay by locality, based on data from the House of Commons Library. The findings suggest that in some
areas more than half of all employees are being paid less than the Living Wage. These areas range from urban centres such as Birmingham Northfield and
Enfield Southgate to rural areas including Dwyfor Meirionnydd. At the opposite end of the scale, the proportion of employees paid less than the Living Wage
is just a little over 10% in several parts of London, but also in Dundee West and Cardiff North.
The Living Wage is an interesting metric, not least because it provides a rough and ready guide to the extent to which workers need support from the
welfare system in order to make ends meet. If there is a high proportion of workers not earning enough to meet basic needs, demands on the welfare state
are likely to be considerable, and consequently government will experience difficulty in making significant reductions in its own expenditure and so in
tackling the budget deficit.
This is just a rough metric, though. In practice it matters who is earning low pay. It may be young people working part-time while still in full-time
education; it may be adult workers with families to care for; it may be one, or it may be both, earners in a two income family. Unfortunately the TUC data,
based as they are on data from the Annual Survey of Hours and Earnings (ASHE), cannot provide much information about this.
Data from the Labour Force Survey (LFS) can, though. It should be emphasised that these data are not as comprehensive as the ASHE data for the
consideration of earnings, but the LFS data nevertheless provide some useful additional information. I have used the most recent available four quarters of
data in the analysis that follows - from 2013Q4 through 2014Q3.
In all, some 27.1% of 16-64 year olds in the LFS data were paid below the Living Wage. This figure is somewhat higher than the ASHE equivalent. This may be
due to differences in sampling or in the way the data are collected, but it should not unduly affect the relativities reported below.
To some extent, there is a concentration of low pay in the youth labour market. If we restrict the sample to those aged 25 or more, the proportion of those
earning less than the Living Wage falls to 23.0%.
Gender differences are marked. Some 32.8% of female 16-64 year olds are paid below the Living Wage, but the corresponding proportion for men is just 20.9%.
If we look just at workers who are not currently married, some 34.8% are paid below the Living Wage. For men who are not currently married, the proportion
is 30.3%.
In many respects, the most interesting group is those who are married. It is important to know the extent to which individuals with low pay tend to have
spouses who also have low pay. The greater the extent, the greater are the implications for poverty and the greater the implications for the welfare
system. Some 19.0% of married respondents with earning partners earn less than the Living Wage. There is a marked gender differential, with the proportions
being 25.9% and 12.2% for married women and married men respectively. Some 5.9% of households with married earners have both partners earning less than the
Living Wage – a much lower proportion than is observed for other groups.
These statistics are instructive in providing greater detail on the demography of low pay. The concentration of low earnings amongst those not currently
married - and in particular amongst women - should be a matter of concern.
The economic recovery, in terms of employment gains, has been impressive so far. While there has been some evidence in recent months of wage increases,
there has also been some evidence that the gains have been skewed, with those in the lower part of the income distribution gaining relatively little. Low
pay is obviously a problem for those who do not receive sufficient earnings to meet their basic needs. But it is also a much wider problem that is
affecting our ability to pay back the deficit. Putting in place the conditions for a productivity revival - encouraging investment in physical and human
capital, stimulating demand - should be the priority for the labour market over the coming months and years.
Director's February report
18 February 2015
One of the major research themes at The Work Foundation in recent years has focused on the issue of youth employment. Three years ago, the numbers of young
people (aged under 25) who were unemployed exceeded a million. This was profoundly harmful to the young people directly affected, of course, and moreover
it represented a huge wasted resource for the country as a whole.
Since then, youth unemployment has fallen along with the overall unemployment rate. The latest data indicate that some 763000 young people are unemployed.
This amounts to an unemployment rate of 16.8%, well above the 5.8% rate that attaches to the labour force as a whole.
The latest set of data on underemployment produced by Bell and Blanchflower - and published on The Work Foundation's website earlier this month - further
highlight the difficulties faced by young workers. Not only are young workers more prone to unemployment than are their older counterparts, but they are
also more prone to underemployment.
Taking the labour market as a whole in the UK, underemployment only became a noticeable feature during the Great Recession. Until 2007, the underemployment
rate tracked the unemployment rate quite closely. But then a gap of around 2 percentage points opened up, and this has started to close only in recent
months. For young workers, however, underemployment has been a feature for much longer. In 2001, the earliest period for which data are available, the gap
between the unemployment rate and the underemployment rate for this group amounted to 4 percentage points. This opened up to more than 9 percentage points
in 2013, and even now remains as high as 7.5 percentage points. This means that, the underemployment rate for young people in the UK currently stands at
some 24%. This is a huge underutilisation of talent.
The Prime Minister has laudably promised to 'end youth unemployment' in the next parliament. The data suggest that such a promise, welcome as it is, does
not go far enough.
The Bell and Blanchflower data throw light also on the incidence of unemployment and underemployment by ethnicity. Taken as a whole, the figures paint an
uncomforatble picture for young people. The unemployment and underemployment rates faced by young people from ethnic minorities - and especially by young
black people - are huge. The unemployment rate for this group remains above 30%. Once account is taken of workers who wish to work longer hours to
calculate an underemployment rate, the figure rises to well over 40%.
Education has long been promoted as a route to a better labour market experience. It certainly helps. But alone it is insufficient to close the gaps noted
above. As we argued in our written evidence to the Education Select Committee last year, young people should be protected from adverse labour market
conditions, and this requires construction of a new framework for the delivery of employment, skills and welfare to work schemes.
The youth labour market is far from fixed. At The Work Foundation we shall continue to conduct research in this important area, informing advice that can
help transform policy to the benefit of (what, given the extent of underemployment, we still consider to be) the missing million.
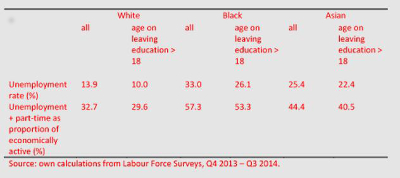
Young, gifted with underemployment, and black
04 February 2015
The latest release of underemployment data in the Bell-Blanchflower series has highlighted sharp differentials by age and by ethnicity in workers’
experience in the labour market. These differentials are explored further in the table below, which draws on pooled data from the most recent available
four quarters of the Labour Force Survey The unemployment rate for young people – those who have left full-time education and are aged under 25 – varies
markedly across ethnic groups. For all groups, however, the rate is well above the corresponding rate for the overall population of working age. The
unemployment rate is particularly high for young black workers. To some extent young people can mitigate the harsh environment of the labour market by
investing more heavily in their own education. Rates of unemployment are lower – and in the case of young black workers markedly so – for those who leave
education beyond the age of 18 than for those who leave earlier.
As is made clear in the Bell-Blanchflower data, the young suffer disproportionately from underemployment, with many young workers wishing to work longer
hours than they currently work. This is captured, albeit crudely, in the table by the second row of data – which shows what the unemployment rate would be
if we counted as unemployed all those who work part-time. The incidence of part-time working across all groups of young workers is huge. Again, young black
workers appear to be the most disadvantaged group.
Education certainly helps young people make their way in the labour market. But the data reported here suggest that a wider range of solutions are called
for in order to alleviate the wasted resource represented by young people.
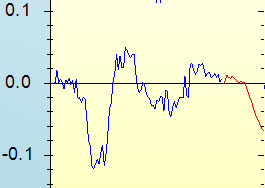
The latest underemployment statistics from Bell Blanchflower
04 February 2015
The latest figures on the Bell and Blanchflower underemployment series have now been produced and are reported below. The underemployment rate is
constructed by adding to the unemployment count a full-time equivalent of the net number of hours for which workers who are currently working fewer hours
than they would like to work are employed. Until 2008, the unemployment series and the underemployment series followed each other closely. Since then, the
rate of underemployment has been consistently above the rate of unemployment. This means that the unemployment rate is no longer a sufficient measure by
which to judge the extent of slack in the labour market.
The figures for the third quarter of 2014 show that, as unemployment has fallen, so too has the underemployment measure. While the gap between the two
rates amounted to more than 2 percentage points in the first quarter of 2013, it is now reduced to a little under 1.5 percentage points. This suggests that
the labour market is returning to normality - but slowly; the unutilised supply of labour is still markedly greater than the relatively low rate of
unemployment might suggest.
There are interesting differences by gender, age and ethnicity. While the unemployment rate is slightly lower for women than for men, the underemployment
rate for women is higher. This suggests that women are particularly likely to be working part-time when they would like to work longer hours.
Amongst young people, rates of unemployment are high - currently just above 15 per cent. But this group is particularly prone to underemployment - the
underemployment rate is almost 24 per cent. At the Work Foundation, we have often spoken of the 'missing million' young workers - with many working
part-time, it is no longer the case that a million young individuals are without work, but the full-time equivalent level of workkessness amongst this
group still amounts to well over a million. This resource has the potential to deliver huge output gains for the economy.
Rates of unemployment are particularly high for young people in ethnic minorities, and, amongst these, particularly so for black youths. There was,
however, a particularly marked fall in the unemployment rate for this group over the first three quarters of last year. But that fall has been accompanied
by only a very slight dip in underemployment. The good news that these workers are finding jobs has to be tempered by the fact that many of them are
looking to work longer hours.
Looking at ethnic minority workers across all age groups, both unemployment and underemployment rates are higher than for white workers. Indeed the
underemployment rate for black workers remains above 20 per cent - though the unemployment rate is a little under 15 per cent.
In sum, the new data provide some encouragement that the labour market is moving in the right direction. The gap between unemployment and underemployment
rates is getting smaller as the economy returns to health, but it is still substantial, and it would be rash to use the unemployment rate alone as a
measure of labour market tightness.
Director's January report
20 January 2015
At the start of a new year, we are all tempted to ask the question: what will the next 12 months bring? So let me try and answer this from the point of
view of a commentator on the labour market in the UK. It’s an easy question to answer in a single word – uncertainty.
That answer is, of course, more than a bit of a cop-out. So let me spell out three areas where this uncertainty is likely to manifest itself.
First, the strength of the economic recovery and the consequent impact on the labour market is likely to depend crucially on developments in our major
trading partners. The recovery in mainland Europe remains weak, and this has already started to put a brake on recovery in the UK. GDP growth in 2015 is
likely to be slower than it was in 2014. How much slower is unclear at this point, however. A major source of uncertainty surrounds the possibility of
Greece leaving the Eurozone – the so-called ‘Grexit’. This has become an issue once again in the run-up to the Greek election on 25 January. When the
possibility of a Grexit was mooted a couple of years ago, the fear of contagion and a subsequent wider collapse of the Eurozone was acute. With interest
rate spreads now being more moderate, such contagion is less likely, but the impact of a Grexit could nonetheless be considerable. This is particularly the
case if the exit were accompanied, or quickly followed, by Greece defaulting on debt. Several of our major trading partners would be exposed in this
scenario and their growth prospects – and hence ours too – would be compromised.
Secondly, the UK’s own election in May will be one in which the policy offerings of the major parties will have distinct labour market effects. The parties
have stated their ambitions for narrowing the budget deficit. In so doing, they make very different assumptions about the way in which these aspirations
will affect economic growth. Take your pick: but whichever set of assumptions you go along with, there will be uncertainty about how growth – and hence the
labour market – will evolve over the coming period while we still do not know the outcome of the election. Moreover, on at least one scenario, further
uncertainty is provided by the possibility of another ‘rexit’ – the ‘Brexit’ – with the possibility of a referendum on British membership of the EU. Once
again you can take your pick about the assumptions you make about the likely labour market costs and benefits of a Brexit – but until you know the outcome
of the election and any referendum, uncertainty will prevail.
Thirdly, there is uncertainty about whether growth in productivity will be restored. Business investment increased healthily over much of 2014, and
ordinarily we would expect to see this reflected in productivity gains. That improvement in investment needs to be consolidated in 2015, however – and the
uncertainties in the environment may not help in this regard.
Even if productivity recovers strongly in 2015, it is not clear that this will translate into a sustained increase in real wages. While simple models
equate wages with marginal product, simple models sometimes fail to capture pertinent information. US evidence suggests that the link between productivity
and wages has broken down. If that is a result of the twin forces of global trade and technological developments, then we can expect to see such a
breakdown in the UK too. Increased productivity may turn out to be a necessary, but not a sufficient, condition for wage growth. It would be good news
indeed if the recent increase in real wages turned out to be sustainable – but whether or not it does still remains to be seen. It cannot simply be assumed
that pre-recession trends will be restored.
In light of all this uncertainty, decision makers in business and government need sound advice and regular updating. At The Work Foundation, we play our
role in this partly by disseminating our work through our newsletter. I hope you will find something useful here.
Rate of growth of weekly earnings now well above the rate of inflation
17 December 2014
The latest release of statistics on the labour market offer almost uniformly good news. Employment levels continued to rise, by 115,000, in the latest
quarter. Meanwhile unemployment fell by 63,000, with the headline rate of unemployment remaining at 6.0%.
The more detailed statistics suggest a continuing trend towards restoration of normality in the labour market. The number of employees in employment
increased by 165000, with a reduction of 29000 in self-employment. Amongst those who are self-employed, the number working part-time fell by 34000 while
the number working full-time rose slightly. Meanwhile the total number of people working full-time increased by 166000, and there was a reduction of 51000
in the number working part-time. This is all reassuring news. We have expressed concern in recent months about the high levels of insecurity that remain in
the labour market. While this is still a concern, the latest figures indicate that we are clearly moving in the right direction.
The employment gains have been particularly pronounced in the utilities, transport and storage, and arts and recreation. The sharpest quarter-on-quarter
change was in the North West, with an increase in employment of some 35000. This region has been performing exceptionally well of late; recent data on
gross value added for 2013 showed it to be (along with Wales) the fastest growing region at 3.4%. Meanwhile employment declined in the most recent quarter
in London and the South East – regions that have been seen as the engines of the recovery.
Arguably the most significant development this month has been the rise in the rate of growth of weekly earnings – up 1.8% on a year ago. This increase is
now well above the rate of price inflation. The increase has been particularly marked in finance and business services (3.0%), with earnings in the
construction industry also rising quickly (2.7%). The recovery in finance comes on the back of a steady increase over the last three months. In
manufacturing, however, the rate of growth of earnings has moderated somewhat, reflecting muted growth in the production sector.
Director's December Report
11 December 2014
The Chancellor’s Autumn Statement earlier this month set out plans for restoring budget balance by 2018-19. These are welcome not least because they have
stimulated debate across the political spectrum about how fast government should go in closing the deficit.
Economic policy both affects and responds to conditions in the broader environment. In 2007-08 public sector net borrowing amounted to only 2.7% of GDP. In
response to the recession it rose to 6.7% and then 10.2% in the following two years. Reversing this has proved to be difficult. After two years of
austerity, the rate at which inroads have been made into the deficit has slowed considerably. In many respects this was a good thing. The economy was
flatlining, and, with monetary policy already as relaxed as it could be, putting the brake on further fiscal tightening probably prevented a second
recession.
A good thing it may have been, but it was also largely accidental. Receipts from taxation have been lower than might have been expected at this stage in
the cycle, and government expenditures have been higher. The reason for this is that the recovery has taken on a peculiar form. Over a million more people
are in employment now than four years ago, and there are more than half a million fewer people unemployed. But the recovery has not been as remunerative
for the Treasury as has been the case in the past, with real wages falling for many years after the trough of the recession. With many new jobs paying
wages in the space between the national minimum wage and the Living Wage, tax receipts from the extra income have been limited, and the government has
needed to pay out additional in-work benefits.
The preponderance of jobs at this end of the wage distribution is due to many factors. The supply of labour is buoyed by the implications of ageing and the
abandonment of a default retirement age, and also by immigration. Global competition and technology both have adverse implications for the demand for
workers of intermediate skill, as witnessed by the ‘hollowing out’ of the labour market. The key issue, however, relates to the primary determinant of real
wages, namely productivity.
Productivity has stagnated in recent years. There are many reasons for this – and we have explored these in depth at the Work Foundation. There is,
however, nothing inevitable about the productivity puzzle. In the US, productivity continued to rise steadily through and beyond the recession years.
The predictions made in the Autumn Statement assume that productivity will rise, bringing about an increase in real wages and hence in consumer spending.
If these predictions turn out to be ill-founded, the target of closing the budget deficit within a few years will be unrealisable. That being the case, one
might have expected more focus in the Statement on how business investment can be supported in ways that enhance productivity.
But of course, enhancing productivity is something that is in businesses’ own interests too. As changes in the world around us redefine how various tasks
are undertaken, so businesses need to undergo a zero-based rethink of the ways in which jobs are configured. How can tomorrow’s jobs best be constructed,
from scratch if need be, so that they use workers’ skills to full effect, and provide workers with career structures, progression, and growth? If employers
could answer that question, they could enhance productivity in their own organisations, offer increased living standards for their workers… and solve the
government’s problems with the public finances.
Autumn Statement lacks a clear vision of the route ahead
03 December 2014
Today’s Autumn Statement tells us something about the way in which the government sees the economy moving over the next few years, and rather less about
how it plans further to reduce the budget deficit.
After peaking at 3% this year, GDP growth is expected to fall to 2.4% in 2015. That is no surprise – indeed I have been predicting a slowdown next year for
some time, and the sluggish performance of the UK’s major trading partners in recent months reinforces the view that broader economic conditions do not
offer a favourable wind. The longer term projections for growth are for it to stabilise at between 2.2 and 2.4 per cent each year to the end of the decade.
This probably has more to do with the structure of the econometric models used in forecasting – which tend to revert to a mean – than any serious
assessment of the economics. We might be so fortunate, but equally we might, post-recession, be in a new world in which the secular rate of growth is
slower than it was before.
The public finances are forecast to improve dramatically beyond the current year. Last year’s outturn was a deficit of £97.5 billion. This year’s is
expected to be slightly lower, at £91.3 billion (down from £133.9 in 2010-11). But by 2016-17 it is expected to be only £40.9 billion, and the following
year just £14.5 billion. In percentage terms – as a percentage of GDP, that is – the deficit is expected to be 5.0% in the current year compared with 8.4%
in 2010-11. It is coming down, but slowly. If the recent strength of the economy were to be maintained, there may be scope for tightening the belt – but
many indicators suggest that this year’s strong performance has been a blip, and the Prime Minister may well be right to suggest that ‘red warning lights
are once again flashing’ in the economies of some of our major partners. In any event, the Autumn Statement provides little information about how the
turnaround that is still sought in the public finances is to be achieved, not least because the changes in planned expenditures and revenues announced
today imply only a small net gain.
Big money changes include an increase in personal tax allowances, a major reform of stamp duty (moving to a marginal rate system), a restriction on tax
relief that banks can claim on losses made in the aftermath of the financial crisis, and new employer contribution rates for public sector pensions.
Moreover, a scheme will be introduced to tax multinational enterprises that seek to declare profits overseas rather than face UK tax; how this will be
implemented is unclear.
Certain items of specific public sector investment are worthy of note – the Sir Henry Royce Institute for advanced materials will attract £235m in
Manchester, and a Big Data centre at Daresbury will attract £113m. These are significant investments in the North West – though the Alan Turing Centre on
Big Data will be located in London (which some may see as perverse given his connection with Manchester). Further investment in the Northern Powerhouse
includes infrastructure improvement, including road improvements in Merseyside and on trans-Pennine routes, HS3, and investment in other rail services.
While the Chancellor announced several public investment projects, the Statement is disappointingly thin on measures to promote business investment. There
are minor changes to R&D credits, and proposals to extend the work of the British Business Bank, notably through an extra £400m under the
Enterprise Capital Funds programme.
On the labour market, there are proposals to extend the National Insurance break for firms employing young workers to cover all workers under the age of 25
on apprenticeship schemes. While it is good to see the importance of youth training acknowledged, it is not clear that this is the best way to achieve
progress in this area. The quality of many apprenticeship schemes remains an issue, and it is in any event not clear that incentives of this kind are
efficient in view of the deadweight associated with providing a break to employers that would in any event have provided the training.
A particularly welcome innovation is the proposal for a loan scheme to finance taught postgraduate education. This will help end the current inequity that
has made tuition at this level affordable (more or less) only to those with private resources.
Overall, the Statement is one with much detail to be pored over, but lacking a clear vision of the route ahead. The cuts that remain to be made in public
spending are severe, and we still await information on where the axe is intended to fall.
Underemployment figures show labour market slack remains
25 November 2014
In recent months, we have published a regular series of data on underemployment in the UK - the Bell Blanchflower Index. These data have suggested that the
extent of underemployment rose markedly during the recession and has remained substantial since.
Now the Office for National Statistics (ONS) has released further information on the extent of underemployment. Around 10 per cent of workers employed in
the UK are working fewer hours than they want. This rises to about 20 per cent for those working in elementary occupations; there is also very significant
underemployment in the sales and customer service occupations and in caring, leisure and other services. For those who are underemployed, the average
extent of underemployment is staggering - some 11.3 hours per week. Clearly many workers who would like to work full-time have access only to part-time
work.
Underemployment is not a phenomenon confined to employees - self-employed workers may also be able to work fewer hours than they would like. The extent of
underemployment amongst this group increased particularly sharply with the recession. While, at the beginning of the last decade, underemployment amongst
the self-employed was around 2 percentage points lower than that amongst employees, the two groups now have virtually identical rates of underemployment.
This reinforces the view that much of the growth in self-employment since the recession has been linked to increasing insecurity in the labour market, the
position of many of the new self-employed being somewhat tenuous.
There is relatively little regional variation in the incidence of underemployment. It is highest in the North East, at 11.5%, and lowest in the East of
England, at 9.2%.
The ONS data also provide information about overemployment - people who would like to work fewer hours than they do. Around 10 per cent of workers fall
into this category, with concentrations in managerial and professional occupations. Health professionals, senior businesspersons (such as CEOs), and senior
officers in protective services (including defence) are particularly affected.
The net level of underemployment (that is, underemployment minus overemployment) amounts to around 900,000 hours per week. This is tantamount to about one
percentage point extra on the unemployment rate. While this figure is somewhat lower than the Bell Blanchflower estimate (largely because ONS use a more
restrictive definition of underemployment), it confirms what we have known for some time: the unemployment rate is no longer a sufficient measure of labour
market slack, and there remains scope for the labour market to improve further without generating significant wage pressure.
The minimum wage and young workers
19 November 2014
New data have been published today on the incidence of low pay. The figures come from the Annual Survey of Hours and Earnings and refer to April of each
year. Four distinct levels of the national minmum wage are relevant: apprentices in their first year and those aged 16-18 had a minimum wage of £2.68 per
hour; for other workers aged 16-17 the minimum wage was £3.72; workers aged 18-20 had a minimum wage of £5.03; and for all other workers the minimum wage
was £6.31.
The data show that the proportions of workers being paid less than the relevant minimum wage is markedly higher for young workers (aged 16-20) than is the
case for those aged 21 or more. For the latter group, well under 1% are paid below the minimum, but for younger employees the proportion is between 2.5 and
3%. In total, some 236000 workers receive a wage below the minimum, of whom 40000 are aged between 16 and 20.
This is, in part at least, due to the incidence of part-time employment amongst young workers, many of whom are still in education. Part-time employees are
much more likely than full-time workers to be paid low wages.
There is some regional variation in the incidence of very low pay - it is lowest in London, the South East and Scotland, and highest (by far) in Northern
Ireland. For the most part employers show a good understanding of the requirements associated with minimum wage legislation. It may be that there is work
still to be done in ensuring that they respond quickly enough to workers' changing minimum wage rates as the employees pass key birthdays or as they
graduate from apprentice status. It may also be that there is work still to be done in communicating effectively to employers their responsibilities to
younger workers.
More generally, there is a need for employers - and for society in general - to nurture younger workers, providing them with jobs that offer a genuine
career path with the promise of development and progression. At The Work Foundation we have undertaken a considerable amount of research in this area, a
useful summary of which appears here .
The latest quarterly data from the Bell-Blanchflower underemployment index
13 November 2014
The Labour Force Survey for the second quarter of 2014 is now available and allows computation of the Bell-Blanchflower underemployment measure for this
period. The time series for this variable, along with comparable data for the unemployment rate, is given in the table and graph below. In these data, the
underemployment rate is directly comparable to the unemployment rate – it adds to the unemployment rate the full-time equivalent net effect of hours that
workers would like to work but cannot. Since the second quarter of 2007, the underemployment rate has been persistently above the unemployment rate. The
gap widened quickly, and by the end of 2009 was almost 2 percentage points. It remained stubbornly at about this level – although it has reduced slightly
over recent quarters.
The gap between the underemployment rate and the unemployment rate is important. It represents slack that still exists in the labour market despite the
impression that might be given by a relatively low rate of unemployment. People who are in part-time work and who want to increase their hours of work can,
as the economy recovers, switch to full-time work. The most recent evidence suggests that an increasing proportion of the new jobs that are being created
are full-time. If this trend continues, then we should expect the gap between the unemployment rate and the underemployment rate to narrow, and the
unemployment rate will once again become an appropriate measure of labour market slack. In the meantime, there is still reason to suppose that unemployment
can fall further without adding substantively to wage pressure.
The overall economic situation is evolving quickly, but there would appear, on the basis of the evidence presented here, to be little reason to countenance
a tightening of policy over the coming few months. The international evidence suggests that the UK has been quite unusual in the extent of underemployment.
Data from Eurostat indicate that – aside from Spain, Cyprus and Ireland, the UK is the country with the highest incidence of part-time workers who are
underemployed. The reasons for this are as yet not well understood, but what is clear is that the old models in which the unemployment rate alone sufficed
as a measure of labour market tightness are no longer adequate.
November Director's Report
11 November 2014
Low pay is in the news. Between 2010 and 2013, the hourly pay of full-time men at the bottom decile of the wage distribution rose from £7.20 to £7.50 – an
increase of some 4.2%. The corresponding figures for women were £6.72 and £7.00 – also representing a 4.2% increase. But over the same period, prices rose
by more than 10%, implying a fall of around 6% in real pay.
In 2013, the Living Wage – which measures the wage deemed necessary for a full-time worker to cover the cost of necessities - was £7.45 per hour outside
London and £8.55 in the capital. It is clear that many full-time workers are being paid less than this basic level. This imposes strain on workers, their
families and communities. It imposes strain also on the public finances as welfare payments support those who could not otherwise make ends meet. It is
opportune therefore to ask what can be done to promote – and justify – higher pay.
Before answering that question, it is important to consider some of the factors that have brought us to the current situation. It is now almost 20 years
since Richard Freeman asked whether our wages are set in Beijing. His point was that global competition in traded goods and services puts downward pressure
on firms’ costs, including wages. This tendency has been exacerbated by the skill-biased nature of technical change, with technology becoming increasingly
complementary to the input of some workers but increasingly a substitute for tasks performed by others. The consequent ‘ hollowing-out’of the labour market
has since been well documented. Over the years since the Great Recession, labour productivity has stagnated . This reflects partly the mix of jobs
available – the productivity of some workers being constrained by the jobs they do – but it also reflects a marked decline in productivitywithin
occupations.
The Work Foundation’s recent report on low pay describes the problem in some detail, and makes recommendations for action by policy-makers and
practitioners. These include the development of new career ladders that are not locked into old patterns but that recognise the constraints and
opportunities offered by technological developments. They include also recommendations on the role that should be played by Local Enterprise Partnerships
and sector organisations in supporting business through times of rapid change in the labour market. Further recommendations concern the remit of the Low
Pay Commission and the role that should be played by the Living Wage in future policy.
It’s not enough though. More work is needed to support businesses and policy-makers in providing a framework that can support a sustained increase in
productivity and pay. At The Work Foundation, we will do our part by continuing to produce research in this area – indeed we are currently entering a new
phase of work. If you would like to know more about this, do please get in touch.
Will devolving powers to Manchester really stimulate economic development?
03 November 2014
The Chancellor of the Exchequer has announced that new powers are to be devolved to the Greater Manchester Combined Authority (GMCA). The GMCA will gain
powers in the areas of policing, planning, transport and housing, and will be required to introduce the post of a directly elected mayor.
These powers are modest and do not offer the promise of any real capability to stimulate economic development. If the north of England is to be able to
position itself as more power is devolved to Scotland and other regions, it will itself need further dicretionary powers.
But the absence of such powers in the current proposals might in fact be a blessing.
For while this move is being portrayed as progress in the development of the Northern Powerhouse, it is not at all clear that it represents a positive
development in that context. The Northern Powerhouse is intended to create a single urban area stretching across the Pennines, bringing in Leeds and
Sheffield as well as Manchester - and reaching out further in both directions along the M62 corridor. Creation of a nexus of political authority in
Manchester may well hinder economic integration of the north rather than aid it.
Northern cities face a drain of human capital to London and they lack the capital's levels of business investment. The disadvantage faced by the north thus
amounts to much more than the lack of a high speed rail link over the Pennines. Integration requires a unified political purpose that is not well served by
creating divisions now between Greater Manchester and weaker local authorities elsewhere.
Creating new jurisdications in a UK that is characterised by devolved government requires careful thought. It should not come about purely as a consequence
of 10 local authorities deciding to work together. Wider interests are at stake, and central government has a duty to take those fully into consideration.
Should Manchester be a metro in its own right? What then of the Northern Powerhouse? So should the metro include Liverpool, Leeds and Sheffield? Maybe. But
what then of Newcastle? And what of the rural areas in between? These are questions worthy of debate. Computable general equilibrium models are used to
evaluate such issues elsewhere. Serious research is needed in the UK too.
Today's first step is not altogether promising.
October Director's blog
14 October 2014
The performance of the UK economy over the last year has been remarkable. Output has increased by over 3 per cent. The unemployment rate, which had
previously been stuck at just under 8 per cent for a long time, has fallen dramatically and now stands at 6 per cent. The benefits of this fall have been
felt by people across the country and in all demographic groups.
There nevertheless remains a curious sense of unease about the performance of the labour market. Productivity has continued to stagnate, and this has meant
that increases in wages have not been able to keep pace with price rises. People in work might wonder why they don't feel better off than a while back -
and the simple answer is: it's because they aren't.
Over the last few months, however, there has been a dramatic turnaround in the level ofbusiness investment. The latest figures suggest a year on year
increase of more than 10 per cent. This should mean that workers have better equipment with which to work. Whether or not they do, of course, depends on
what lies beneath the aggregate figures. But if they do, then we should, within the next year, start to see productivity grow once more. That would at last
bring about a renewed increase in real wages.
Increased investment should also serve to ease capacity constraints, hence allowing further growth. While a low unemployment rate might ordinarily indicate
that there are capacity constraints arising also from a limited workforce, that is unlikely to be the case at present. Underemployment - where many people
are working fewer hours than they would like - and a high incidence of (what appears to be involuntary) self-employment both suggest that there is room for
further growth in the number of hours worked. To be sure, in some sectors - particularly advanced manufacturing - there are emerging signs of skills
shortages and rising real wages, but this is very much the exception rather than the rule. There remains considerable slack in the labour market, and, this
being the case, there is no sign yet of inflationary pressure. A reasonable estimate of the ‘natural rate’ of unemployment on the basis of recent years’
data suggests that unemployment could fall to as low as, or even slightly below, 4 per cent before inflation kicks in.
The remarkable growth that we have seen in recent months should not, however, blind us to the fact that it is remarkable. Looking forward to 2015, it would
be surprising if output were to continue to grow at the present rate. Growth in our major export economies remains sluggish, and exchange rate movements
over the last year are not helpful. As the EEF has recently cautioned, the outlook for demand is less certain now than it has been for while. Indeed, the
latest data on industrial production suggests that – in the production industries – growth has stalled. The economy overall should continue to grow next
year, but at a slower pace than we have seen in recent months.
Migration and the labour market
30 September 2014
The CIPD has today (30 September 2014) published a landmark study on the growth of migration to the UK from other parts of the EU. Migration is an emotive
subject, and the report is likely to attract widespread attention. Based as it is on significant new research, it should serve to enrich the evidence base
upon which discussion takes place. It is therefore very welcome.
As a proportion of total employment, the number of non-UK born workers has risen steadily over time; now at around 15%, the percentage has doubled since
the late 1990s. Employment of non-UK born workers from the accession countries of eastern Europe shows a step change after 2004, when unrestricted
migration within the EU became possible for workers in these countries. These migrants have been disproportionately employed in low skill occupations - in
sharp contrast to migrants from western Europe and those from outside the EU that are subject to visa regulations. Hence they tend to be disproportionately
employed as cleaners, caretakers, catering assistants, and so on - typically jobs that are not directly customer facing and which do not demand strong
communication skills. But migrants from the EU are also disproportionately employed as accountants and IT specialists. So the picture is considerably more
nuanced than popular conceptions might suggest.
Many of the migrants from eastern Europe, in particular, are overqualified for the jobs that they are currently undertaking. Indeed, since 2007, most
migrants from these countries who have degrees have been employed in low skill work. There would appear to be significant scope for increasing productivity
within the UK economy simply by employing these migrants' skills to best advantage. It is important, however, to note that employers do not consider
migrants generally to be working below capacity within their current jobs. Facilitating job mobility amongst well qualified migrants thus offers the
promise of high returns.
Employers cite the main reasons for employing migrants to be availability, followed by their work ethic and the congruence of migrants' values with those
of the employing organisations. Some 26% of employers claim to have found difficulties in finding UK born workers to fill unskilled or semi-skilled jobs,
and 20% employ migrants because of the perception that they have a better work ethic than UK born workers. The attributes that employers particularly value
amongst migrants include their teamworking skills, their orientation to customer service, their conformity to what the organisation wants, and their
integrity.
While employers who employ migrant workers report a beneficial impact, those who do not employ migrants tend to report that they do not perceive a benefit.
This suggests that there are few spillovers. In particular, migration does not appear to be benefitting employers by pushing down the general level of
wages. Only 6% of employers claim that they would raise wages to fill posts were migrant workers not available.
Migration is not, in any large measure, displacing training. Employers who recruit migrant workers are more likely than other employers to be investing in
training and apprenticeships. To some extent, this results from a scale effect - larger employers are more likely to do employ migrants and more likely to
train.
There is a marked spatial difference in UK workers' attitudes to migrants - low skilled workers in London regard migrants more favourably than those
outside the capital. This may be related to the high stock of migrants in London - a case of familiarity breeding acceptance rather than contempt.
Meanwhile, there is concern that migrants who take on low skill work are competing with UK domiciled school leavers. This serves to focus attention on the
skills with which these school leavers are equipped. Over a third of 16 year old school leavers - and almost as many 17-18 year olds - are deemed to be
poorly or very poorly prepared for the world of work. Equipping them better is clearly a prerequisite for enabling them to compete effectively and secure
good jobs.
And this is the overall impression with which one is left after reading the report - migration is really a red herring. It is time for the debate to move
on to this: how can we best equip young people born and raised in the UK so that they can compete effectively in the labour market - without a need for
protectionism?
September Director's report
17 September 2014
As recently as two years ago, there were over a million young people, between the ages of 16 and 24, unemployed in the UK. The figure has fallen sharply as
the economy has recovered, and the latest figure is just under three quarters of a million. The problem of youth unemployment seems to be receding fast.
But the new generation of workers faces a labour market that is changing rapidly, one in which the sources of insecurity are many. Technological change is
leading to a redefinition of many jobs. Reports of robots stealing humans' employment are surely a case of sensationalism - after all, the humans are still
available to work. But the type of work that people are called upon to do is changing. Many observers have referred to a 'hollowing out' of the labour
market, or the development of an 'hourglass' labour market - one in which the demand for labour at the extremes of the skills distribution is buoyant, but
the demand for intermediate skills is stagnant.
Matching young people's skills and potential to the jobs that are available is made difficult when the distribution of these skills differs substantially
from the patterns of skills that are in demand. As the demand for skills evolves with the introduction of new technologies, so workers must be equipped to
complement these technologies to best effect. This means training and re-training through the life cycle - and a much more fluid relationship between
education, training and work than we have seen before. It also means that career structures within organisations need to be dismantled and redesigned so
that progression remains possible. Young people need to develop their abilities in ways that enable them to contribute their utmost, and they need to know
that they can be rewarded with careers, not just jobs.
The Work Foundation will be hosting fringe events at party conferences over the next month. These events, 'More than a job -creating career opportunities
for young people' will focus on the challenge of providing young people with careers that entail a process of skills development, productivity enhancement,
and progression. Put together, this amounts to a new covenant between society and our young people - one that protects them and nurtures their talents. If
we fail to achieve this, the long term outlook for our economy is one of stagnation, but if we succeed, the potential rewards are huge.
A recovery that is struggling to sustain itself
17 September 2014
Unemployment has continued to fall, with the rate now standing at 6.2% (compared with 6.4% in last month's statistics). The number of employees in
employment has risen by some 65000 over the last quarter. Almost half of this gain (some 30,000) is in part-time work, once again reinforcing concerns that
there remains a significant measure of underemployment. The numbers of part-time self-employed workers have also risen (by 17,000), but full-time
self-employment figures have fallen (by 13,000), emphasising the insecure nature of many of these jobs. Overall, while the continued fall in unemployment
is welcome, the impression given by these data is one of a recovery that is struggling to sustain itself.
At regional level, there have been marginal increases in the unemployment rate in the North East, the South West and in Wales. By some distance, this
leaves the North East (at 9.9%) the region with the highest unemployment rate.
Of those regions where the unemployment rate has fallen fastest, the fall has been especially pronounced in the North West, Yorkshire and Humberside, the
East Midlands, London and Scotland. The unemployment rate in Scotland, at 6%, is currently the lowest of any of the four home countries.
One reason why the rate at which unemployment might be slowing down is that it has fallen almost as far as it can go - in other words that capacity
constraints are starting to bite in the labour market. If that were the case, we would start to see skills shortages and consequently increasing earnings.
There have, to be sure, been some signs of this in some sectors, notably manufacturing, in recent months. But overall, the rate of growth of earnings
remains extremely muted. In July, the year on year growth in average weekly earnings amounted to just 0.7% - up from 0.6% the previous month but still a
long way short of the current rate of price inflation. Wage inflation remains relatively high in manufacturing (1.8%) though it is slowing. In
construction, wages rose by 4% year on year - and this sector will be an interesting one to watch over the coming months. But in services, which dominate
the UK economy, wage growth is still very sluggish indeed (0.3% overall), and wages are still falling in some sectors. While underemployment remains so
high, the evidence from earnings data is that we are still a long way short of capacity.
The resolution of the cost of living dilemma lies in boosting productivity. But this remains stubbornly sluggish. The large increase in business investment
over recent months should help restore productivity growth, so there is cause for some degree of optimism that real wage growth should reappear sometime in
the next year. But, as The Work Foundation's roundtable on productivity established, there are likely to be some deep-seated and long-lasting barriers to a
rapid recovery. Growth may continue, but it is likely to do so at a slower rate than in recent months, and it is clear the restoration of a fully normal
economy is going to be a long term project.
Education at a glance
09 September 2014
The OECD has published its annual review of education statistics, Education at a Glance. As ever, this provides a wealth of data that together contribute
to provide a fascinating insight into the world of education in developed countries.
The report raises concerns about changes in the extent of social mobility. Averaged across all countries in the report, upward mobility across generations
- measured by the proportion of a younger generation that is better educated than its forebears - is falling as new cohorts enter the labour market, and
downward mobility is increasing. The report describes this as a 'setback' though in truth it may just be an artefact of the data. At a time when a high
proportion of parents are well educated, it is naturally less possible for a high proportion of their children to be better educated than their parents.
Averaged across the countries in the sample, graduation from upper secondary level has continued to rise steadily over recent years, and has reached a high
of 84% in 2012. By way of contrast, the report finds that the graduation rate from tertiary education fell slightly in 2012; this result should however be
treated with considerable caution, since some countries (Luxembourg, Chile) with low rates entered the data only in 2012, while other data for this year
are not yet available for other countries (Australia, the UK) with high participation rates in higher education. Overall, the picture is one of continued
high and rising levels of enrolment in post-compulsory education.
This is unsurprising, since the incentives to participate in education remain very high. Averaging across the OECD countries, higher education graduates
earn around 60% more than upper secondary graduates - who in turn earn around a third more than lower secondary graduates. These proportions have remained
virtually unchanged over the last decade and a half at least. The distributions are somewhat more compressed in some northern European countries (notably
Sweden, Denmark and Estonia) but are remarkably consistent across the other countries in the data set.
While the concerns raised in the report about social mobility may overstate the extent to which younger generations are disadvantaging themselves by not
investing as much as their parents in education, the fact that education is a major driver of individual progress remains as true as ever.
Bridging the skills canyon
04 September 2014
Today (4th September) sees the launch of an important new report by the Centre for Cities and the Joseph Rowntree Foundation. The report concerns the role
that cities need to play over the coming years in providing individuals with a route out of low paid employment and into more productive and remunerative
work.
The squeezed middle of the skill distribution has received considerable attention of late. There is much evidence, in the new report and elsewhere, to
suggest that the demand for intermediate skills is falling in relation to that for skills at the top and bottom ends of the distribution. This has often
been put down to the effects of new technology. Robots can undertake many of the tasks that have been performed by workers of intermediate skills,
heretofore. Moreover, new technology could replace some functions of highly skilled workers, taking over the role of diagnosis from medical practitioners,
for example.
Carl Benedikt Frey and Michael Osborne at Oxford University have gone so far as to suggest that around 50% of current jobs could vanish over the next 20
years as a consequence of computerisation. This has, understandably enough, led to some hysteria. But the reality is that jobs are each made up of a number
of tasks; it is the tasks, not the jobs themselves, that are taken over by technology. As workers find technological solutions to make their jobs easier,
the technology takes on some of the burden of their work, but the humans turn their efforts to other tasks. Jobs don't vanish. They morph. And, even if a
job currently undertaken by a human were to vanish, that human would still be available to do other jobs.
The squeezed middle is nevertheless a real phenomenon, and we do face the danger that some people might get locked into low productivity, low pay work, and
that they might be unable to traverse the canyon that is emerging between such jobs and the high quality jobs that are well remunerated. It is crucial to
remember at this point that it is the demand for skills that is bifurcating, not the supply. Workers are as able to make incremental improvements to their
skill sets as they ever were. The gap between the low paid jobs and the well paid jobs should not be harder for them to bridge simply because the canyon is
wider - many of those in low skill work have skills that exceed those required to perform their jobs, and it should in principle be possible for them to
upskill and make the jump to a better quality job. In a world populated by baristas and bankers, many of those in low productivity occupations already have
the ability and many of the skills needed to undertake higher productivity work. Identifying those who can and investing in them offers the prospect of
huge returns.
There is, however, a great difference between what should be possible and what actually happens. Ensuring that as many workers as possible are empowered to
make the most of their abilities is going to be more crucial than ever to economic development. The reward is that, in this new world, relatively small
investments in skill development can lead to substantial changes in the qualitative nature of the jobs that (at least some) workers can do. These
investments are critical to the growth of productivity. By ensuring that the investments are made, cities, regions and the national economy stand to gain
much in terms of output growth.
Cities have a key role to play, not least because the skill sets required within one urban area can differ substantially from that needed in another. Fully
taking advantage of opportunities to enhance productivity requires a local steer. Ensuring that human resource development meets industry needs calls for
training that is led by business. Cities, employers, education providers and central government all need to work together to face the new challenges. In
focusing on the role played by cities, the new report admirably draws a road map that will be useful in tackling the challenges that lie ahead.
August Director's Report
13 August 2014
Over the last 30 years, life expectancy at birth in the UK has been increasing by 2½ years per decade. A boy born now can expect to live to the age of 79,
while a girl can expect to live to the age of 83. Moreover, the increase in life expectancy that we have seen in recent decades isexpected to continue, so
children born in 2030 will expect to live even longer than those born now.
The ageing of the population has clear implications for those who are of working age. To support themselves in retirement, people will have to save more
while they are working and they will have to work longer. Both of these solutions present challenges to individuals, employers and government.
The savings rate in the UK has remained stubbornly low in comparison with international peers. Many large employers have put in place a variety of schemes
– including share ownership schemes – that encourage their workers to save. But there remains a dearth of serious research that can inform us about how the
detailed design of such schemes serves to incentivise different patterns of individual and aggregate saving. Insights from behavioural economics are likely
to be useful here; in particular, the idea that small policy changes can ‘nudge’ people into behaving in radically different ways. At the Work Foundation,
we are planning to investigate these issues using the Lancaster Experimental Economics Laboratory (LexEL), and our intent is that the insights we gain from
this will be profitably put into practice in many organisations.
Longer working lives also have implications for organisations as they manage their human resources. Succession management, promotion structures, human
resource development, an increased demand for flexible working, and the management of capacity issues are all likely to be challenged by increased
longevity. The scale of change is likely to be accelerated by the move from defined benefit to defined contribution pensions, not least because the impact
of economic turbulence on pension pots has been adverse, leading many workers to delay their retirement. The extent to which employers have prepared
themselves for what is likely to be a very rapid change is unclear. More clear is the fact that, in the new world, they will need to learn best practice
from each other very quickly.
At The Work Foundation, we are developing a new programme of research on ageing. This will cover all of the above issues and more. If you are interested in
finding out more about our plans, please get in touch with me – I shall be most keen to hear from you.
July's Director's report
15 July 2014
Unemployment scars people. This has been known for a long time, as has the importance of this for macroeconomic policy. If, as a result of a temporary
downturn in the economy, more people become unemployed, then, as the economy recovers, these people will find it relatively difficult to regain employment.
That means that what ought to be just temporary blips in unemployment develop a more permanent component. This phenomenon is known as hysteresis.
Two recent events at The Work Foundation have thrown the question of unemployment hysteresis into sharp relief. The first was the launch of our new report,
‘Sick of Being Unemployed’. This investigates the interplay between episodes of unemployment and ill health amongst men. Unemployment is a stressful
experience, and it is perhaps not surprising that it can lead to mental health problems. It can also, in consequence, result in behaviours that lead to
physical health problems – illnesses associated with smoking, drinking, or a sedentary lifestyle. Once their health suffers, the unemployed face a double
whammy – sick unemployed people are particularly unlikely to find their way back into work. So unemployment becomes hysteretic. Our report focuses on men,
because the evidence suggests that men are less capable than women in coping with unemployment – or at least they are less able to insulate health from
their labour market misfortunes. Managing the return to work for men who have suffered ill health is particularly important because work can contribute to
their recovery. At the macroeconomic level, if we can manage more people back into work, we can both raise output in the short term and break the vicious
circle that hysteresis represents.
Some (relatively) good news is that the Great Recession (in the UK) did not result in a massive increase in overall unemployment. While this is reassuring
to some extent, when we drill down to more detailed figures, there remains cause for concern about the longer term legacy of the experience of the last few
years. Youth unemployment did rise markedly during the recession, resulting in over a million young people being out of work. We have analysed this
phenomenon in some detail at The Work Foundation.
The second of our recent events was a seminar on young people and the recovery. This included the presentation of a paper by Mark Bryan and Alberto Tumino
which documents the long term scarring effects of unemployment on young people. Particularly striking is the fact that the scarring appears to be deeper if
young people first enter the labour market during times of recession.
Does this mean that the damage is already done? Have we lost a generation of young people? Not necessarily. But it does mean that that generation will need
unusual support to help them face the challenge of first entering employment and then living up to their full potential.Apprenticeships help – but they
need both to target the right people and to provide continuing support. Monitoring, and responding effectively to the needs of, those currently in their
early to mid-twenties will be a crucial investment. The penalty for getting it wrong is unfulfilled lives and a huge loss of potential output.
June Director's Report
10 June 2014
The European elections last month pushed to the fore questions about migration. These were reinforced on polling day by the release of the latest
statistics on immigration. These showed that the number of work-related visas issued in the last year has risen by some 10% - the bulk of this increase
being in the skilled (tier 2) category. In the year ending March 2014, the total number of work-related visas issued was a little over 156,000. The
government's target of reducing immigration to the tens of thousands appears to be slipping further away.
That might not be a bad thing. People migrate because they can benefit from doing so. To an approximation, workers get paid in line with their
productivity. If their productivity is greater in one place than in another - perhaps because the equipment they have to work with is better, or because
other resources are better, or because they are better managed - then the output of Earth Inc. rises, and we all benefit from that.
Of course, the world is not really quite so simple. Rapid movements of population bring about pressure points. Public services may be strained if the size
of a local population is rising rapidly, and (leaving the economics aside for a moment) people take time to adjust to new environments and new neighbours.
Leaving economics even further behind, people seem to believe that migration is bad for the labour market prospects of people who were born here; others
suggest that it is bad for the public finances. These notions have been comprehensively debunked by many studies - see for example an early Work Foundation
study on labour market effects, and the recent OECD report on the tax and benefit implications. Despite the evidence, these issues seem to remain a concern
for many people.
At least some of the above issues mean that there is a need for managing migration, and that is exactly what the government's points system aims to do. For
sure the system could benefit from some tweaks - it is not easy for smaller firms to navigate, and larger firms face challenges over its impact on
intra-company transfers. But the underlying premise of the system seems sound.
The points system does not, of course, cover migrants from the European Union. Neither do the figures on visas reported above. While the policy position
with regard to European migrants stays as it is, policy concerning migration from outside the EU has to flex to accommodate changes in flows of European
migrants. This imposes an added layer of complexity.
Debates about migration tend to polarise, with one side arguing for open borders and the other for tight controls. This does not seem to be a very grown up
way of going about things. We know that there are benefits to migration, and presumably these decrease (at the margin) as migration increases. We know
there are, in the short term at least, costs. So it should be possible to inform the debate by forming an evidence-based view about the optimal rate of
migration.
Policy-makers who wish to show some leadership on this issue might want to consider developing proposals that are based on evidence. They would then likely
face the task of educating the electorate. But the benefits attached to getting this right - something that is unlikely to happen by accident - could be
considerable.
The productivity puzzle - real or imagined?
28 May 2014
The economic history of recent years has been quite remarkable in many dimensions. One of the most notable features has been the sharp decline and
subsequent stagnation of labour productivity. Between 2007 and 2009, output per worker fell by over 5%. Over the subsequent four years, it rose by just 1%.
Since, owing to advances in technology, productivity usually grows year on year, the full effect of this is that productivity is now almost 20% below the
long run trend.
These statistics make the recent recession very different from many other recessions, particularly those of the 1980s and 1990s, after which productivity
recovered quite quickly. The initial decline in productivity is likely the result of a fall in demand; but one would normally expect firms to adjust their
labour input in line with this fall, thereby raising productivity, quite quickly. The prolonged fall in productivity is thus something of a puzzle. It is
not easy to imagine why we should have stopped being as good at doing things as we once were.
This productivity puzzle was the theme of a recent roundtable held at The Work Foundation. The context was set in presentations by Jonathan Haskel and
Charles Levy, with subsequent discussion involving representatives from the Treasury, the Department for Business, Innovation and Skills, the Office of
National Statistics, the Bank of England, and several other key agencies. While it is fair to say that (unsurprisingly enough) the roundtable did not solve
the puzzle, it succeeded in identifying several issues that are likely to be key to a solution, and also identified a promising and important agenda for
further research.
Several partial candidate explanations for the apparent slowdown in productivity were identified. Amongst these were:
• Changes in the composition of industry, notably the decline of capital intensive, high productivity, extractive industries such as oil. This may be a
partial explanation, but we know that productivity has declined within a wide range of sectors, not just in some industries.
• A decline in successful innovation, particularly in industries such as pharmaceuticals. This may contribute to falling productivity in some industries,
but it cannot explain the drop in productivity in industries that are less sensitive to innovation.
• Change in the composition of investment, with much investment now taking the form of R&D, design, brand management, reputation, and software
development. Over the last 20 years, such ‘intangibles’ have come to represent a far greater proportion than before of the economy’s investment – up from
under 10% to some 35%. When firms invest in intangibles, they seem to be spending resource on workers’ pay without getting a return – the intangibles are
not (by and large) treated as an investment in the national accounts, and so national output is mismeasured. This would suggest that GDP is, in reality,
higher than official figures suggest, and that productivity has not really fallen (or at least not by as much as the published data would lead us to
believe). However, investment represents a relatively small portion of GDP, and the increase in (unmeasured) investment would need to be far larger than is
currently the case if it were to explain more than a small part of the apparent decline in productivity.
• A change in the capital:labour ratio brought about by lower real wages. As real wages fell during the recession, firms may have substituted labour for
capital, with the hiring of lower productivity workers becoming increasingly worthwhile. Certainly, investment in physical capital has fallen and has
failed (so far) to recover – though many observers expect a marked bounce-back this year. To the extent that this has led to a deterioration of the toolkit
with which workers can use to undertake their jobs, one would expect it to lead to declining productivity. But whether the fall in the relative price of
labour has been sufficient of a trigger to bring this about is moot – especially given that a change in investment needs to be sustained over several years
to have a marked effect on the total stock of capital.
• The hollowing out of the labour market – a process whereby technology has led to the erosion of opportunities for workers with intermediate level skills.
Employment gains in recent years have been concentrated in low skill sectors, including retail and hospitality, and this may explain in part the decline in
overall productivity aggregates. Yet we know that this cannot be the full story because productivity appears to have declined across the piece, not just in
some sectors.
• Underemployment is a phenomenon that has drawn much recent attention, with many workers now being employed for fewer hours than they would like. If the
decline in productivity manifested itself only as a fall in output per worker, this might provide a convincing explanation. However, we have also observed
a significant decline in output per hour worked. So underemployment does not appear to be the story.
• The increase in self-employment. We still know relatively little about the nature of the new cohorts of self-employed workers. If they are concentrated
in low productivity occupations, then the rising incidence of this category of work might play a part in explaining the decline in output per unit of
labour employed. The self-employed still constitute a relatively small part of the workforce, however, and they are likely therefore to provide only a
small part of an explanation. Moreover, the increase in the numbers of self-employed workers has accelerated sharply over the last twelve months, and of
course the fall in productivity predates that by several years.
• The operation of the financial sector. In the years leading up to the recession, banks may have supported the development of firms that are characterised
by relatively low productivity. Following the downturn, by the same token, they may have been unable to support firms whose productivity profile is better.
In this respect, we may now have inherited a stock of firms that is suboptimal.
This last point, in particular, has generated considerable discussion – given the role played by the financial sector in supporting businesses in all
industries, it is a candidate explanation that is likely to have affected firms right across the economy, and it does not rely on an heroic assessment of
the impact on the capital stock of a fairly small change in the relative price of labour. We know, from work done at the Bank of England (see especially
Chart 18) that most of the change in productivity over the last decade or so is due to change that has happened within firms – not between firms in
different sectors. So anything that can offer an explanation for declining output per worker (or per hour) that is not sector-specific has particular
appeal as a prospective explanation.
In light of the above, the roundtable agreed that an appropriate programme for further research in this area might profitably focus upon:
• Establishing a better understanding of the nature of the new cohorts of self-employed workers
• Evaluating the changing nature of investment in the modern economy, disaggregated into land, buildings, physical capital, intangibles etc.
• Exploring the nexus of links between the banking system, capital markets, ability to borrow, and new firm formation; assessing the potential for new
models of banking to deliver a stock of employers with optimal characteristics
• Evaluating the role played by uncertainty in the low rate of investment (and hence low productivity).
NEET hotspots – national improvement masks real issues for many places
22 May 2014
Today’s news on young people not in employment, education or training (NEETs) provides further encouraging news on the improvement of labour market
conditions. The overall number of NEETs in the UK has now fallen below a million. The (seasonally adjusted) fall of 61000 in the most recent quarter
follows a fall of 37000 in the last quarter of last year; the unadjusted fall in the most recent quarter is 94000, this figure being boosted by the large
numbers of young people who leave education after the summer period. The bulk of this fall in NEETs (some 53000 in England alone) is observed amongst 18-24
year old males.
The data also confirm some broader regional patterns that are emerging from the wider range of labour market data. In the North East, the numbers of NEETs
increased in the last quarter, bucking the trend observed elsewhere in the country. In some other regions that appear also to be struggling to secure the
benefits of the recovery, such as the East and West Midlands, and also the East of England, the fall in the number of NEETs is small. Other regions,
including London, the South West, the North West and Yorkshire and Humberside observed relatively large falls in NEETs – very welcome news. The fall in
Yorkshire and Humberside is particularly noteworthy, not least because this region contains some of the localities in which the NEET rate has been highest
amongst young people – the latest available sub-regional data indicate that Barnsley, Wakefield, Bradford and Hull all had rates above 20%. The Work
Foundation’s map of NEET incidence shows quite starkly how varied experience is across geographies, this no doubt reflecting how the recovery more
generally is impacting differentially across industries and across space.
‘Squeezed middle’ is a phrase used in various contexts – but the emerging evidence on the regional impact of the recovery seems to suggest that it is quite
an apt description of the geography of current economic experience, albeit with a squeeze also in the North East.
May Director's report
14 May 2014
There has been a lot of good news about the economy recently. Output is growing rapidly and has now (finally) almost climbed back to pre-recession levels.
Likewise there is much encouraging news in the labour market, with a rapid fall in unemployment over recent months. Meanwhile vacancies have been rising
steadily over the last two years.
In the first quarter of this year, notified vacancies stood at 611000 - over 100000 more than a year earlier. There has been a particularly sharp rise in
vacancies in industries employing highly skilled workers - including health, education, business services and (significantly) in science and technology.
This increased demand for skills has been reflected also in work by the UK Commission for Employment and Skills, who argue that skills shortages are
emerging in some sectors. We might expect such shortages to be reflected in rising wages - and indeed the year on year change in weekly earnings has now
started to rise more quickly, and is on the point of overtaking the rate of price inflation. In some industries - particularly in manufacturing - the rate
at which wages are rising does seem to indicate that employers are indeed starting to run up against skill shortatges.
Yet some observers argue that a sustained increase in real wages is unlikely. They point out that productivity has flatlined over an extended period, and
that gains in productivity are needed to drive real wage increases. They argue further that, in any event, the link between productivity and real wages may
be weaker than in the past - though economic theory suggests that such weakening would be anomalous. And they suggest that, with the rise in unemployment
during the recession being rather modest, unemployment is unlikely to fall enough with recovery to bring about serious wage pressures.
This may be the case. Or it may not. One thing that is clear from the recovery so far is that the world we now inhabit is very different from the one we
lived in before the recession. I have written in earlier director's reports on the appearance and stubborn persistence ofunderemployment and about the rise
of self-employment. These are indicative of continued labour market slack - yet other evidence is pointing to a market that, at least in some dimensions,
is getting increasingly tight.
Much discussion about the current state of the labour market emphasises the effect that changes in technology are having on the qualitative nature of the
demand for skills. These changes are those that appear to be hollowing out the labour market - reducing the demand for intermediate skills while raising
the demand for workers at the extremes of the skills distribution. In times of such rapid change, underemployment for some may well be accompanied by
skills shortages. If this is the world we are now in, then it calls for rapid adaptation - an education and training landscape that is characterised by
fleetness of foot. For all involved - workers, employers, and those responsible for the education system - that represents a considerable challenge.
What do the latest GDP figures tell us about growth?
29 April 2014
The latest data indicate that, in the first quarter of this year, GDP grew by 0.8%. This implies a very healthy 3.1% growth over the course of the last
year.
The performance across sectors is uneven, with particularly strong growth in manufacturing and in distribution. Manufacturing grew by 1.3% over the
quarter, and by 3.5% over the year. This is clearly good news in that it addresses concerns that the UK had, before the recession, become over-reliant on
services. Strong growth in manufacturing helps raises incomes, but with developments in technology making this sector increasingly capital-intensive, the
progress of the sector may not be reflected in such strong employment growth. The extent to which this concern is well founded will require monitoring as
the recovery progresses. The strength of recovery in the distribution sector (which includes, amongst other things, retail and wholesale industries)
reinforces the extent to which this has, at least until very recently, been a recovery led by consumer spending. Recent forecasts from, amongst others, the
EY ITEM group, suggest that investment is set to rise significantly this year; if it does, then that will strengthen the underpinnings of a recovery that
has, till now, been built on rather fragile foundations.
Other metrics of the recovery, including house price changes, suggest that experience across the regions is very patchy. Data on output growth by region
are produced with long lags and are not considered to be terribly reliable, but the evidence that this recovery is spatially uneven suggests that the very
encouraging aggregate statistics may serve to conceal what is, in reality, a much more nuanced picture. The data on underemployment released by The Work
Foundation likewise suggest that the impact of output growth on the labour market is very different to – and less comforting than - what we have
experienced in the past.
Nevertheless these most recent data offer much hope that the economy is indeed recovering.
The latest quarterly data from the Bell-Blanchflower underemployment index
29 April 2014
The latest BellBlanchflower data on underemployment, published here on The Work Foundation website today, provide a mixed picture of the current state of
the labour market in the UK. There is evidence of some improvement over the course of the second half of last year, and that improvement is very welcome.
Yet the data send a clear signal that the labour market in the aftermath of the Great Recession is a very different place to the labour market before.
The unemployment rate peaked in the last quarter of 2011, but the subsequent decline in unemployment was very slow - indeed it did not change at all in the
year to the second quarter of last year. In the second half of last year, however, the rate started to fall dramatically, and the most recent evidence is
that this fall has continued into the early part of 2014.
The rate of unemployment does not, however, reflect the experience of those workers who would like to work longer hours than their employers will hire them
for - that is , underemployment. The BellBlanchflower data adjust the unemployment rate statistics to allow for this underemployment. In the period before
the Great Recession there was very little underemployment, but that is not the case in the period since. Indeed, underemployment is tantamount to almost an
additional two percentage points on top of the official unemployment rate. We might see underemployment as a useful thing during the period of recession -
it may have served to spread the misery of the downturn more evenly than would have been achieved by having more people fully employed and more people
jobless. But the persistence of underemployment through the early stages of recovery suggests that the labour market has still not adjusted back to what we
once thought of as normality. In the most recent quarter for which we have data, the extent of underemployment rose slightly (though it had fallen slightly
in the previous quarter).
The detailed data produced by BellBlanchflower suggest that underemployment is a particular problem for young workers. A recently published report by The
Work Foundation analyses the spatial differences in youth unemployment, which are considerable. It will be instructive, in the coming months, to examine
further the spatial aspects of underemployment - something that we intend to do here.
There are indeed some very encouraging signs of recovery in the macroeconomy. What is clear, however, is that the nature of this recovery is more than
usually nuanced. The fact that the overall unemployment rate is falling is unambiguously good news, but it may be concealing experience that is not so
rosy. There is some evidence of fear leading to larger numbers of people working unpaid overtime, of a rising trend in self-employment where large numbers
opt for this path in the absence of other options, and of underemployment especially amongst the young. At The Work Foundation, we intend to continue our
research into these areas and to keep them at the forefront of the public debate.
Latest labour market statistics provides a dose of good news all around.
16 April 2014
This morning's release of the latest labour market statistics provides a dose of good news all around. The unemployment rate has fallen below 7%, and
earnings are rising at 1.9% over the year. The rate of earnings growth is particularly pronounced in manufacturing, where it is 2.8%, possibly reflecting
the onset of skills shortages. In finance and business services, meanwhile, earnings have grown at only 0.3%, possibly reflecting in part the decline of
bonuses.
The detailed data still paint a more nuanced picture. Take productivity as an example. Output per job rose by 1.3% over the year to quarter 4 in 2013. This
is a marked improvement on the 0.5% achieved the previous quarter, and certainly better than the declining productivity that was still being experienced in
the first quarter of last year. However, improvement in output per hour has been considerably less impressive. This was still falling as recently as the
third quarter of last year. The final quarter figures are a little more encouraging (suggesting 0.7% growth on a year earlier), but remain fairly muted.
Another aspect of the labour market which has been interesting in recent years is the dramatic rise of self-employment. Between December-February and the
previous quarter, self-employment rose by some 146000, and the total now stands at more than 4.5 million. The latest figure represents a 7.1% change over
the year. Self-employed workers now comprise 14.8% of the workforce. We know that much of the increase in self-employment has taken place amongst older
demographic groups, and it remains unclear how much of the rise is due to entrepreneurial development as opposed to people running out of labour market
options. Clearly more research is needed on this.
In sum, therefore, the statistics are encouraging. But the labour market is clearly changing rapidly, and an exclusive focus on the headline metrics risks
being more than usually misleading.
The Director's Report - April Issue
11 April 2014
A recent report from the CIPD and LUMS, with input from the Work Foundation, examines theChanging Contours of Fairness. In the workplace, what is perceived
to be fair or unfair is often the trigger for a whole variety of disputes and managerial headaches.
Fairness means different things in different contexts. A worker who perceives her own productivity to be greater than those of her peers might think that
it is unfair if they are paid as much as she is paid herself. The whole workforce of an organisation might perceive a below-inflation pay rise to be
unfair, in that it disadvantages them as a group relative to workers in other settings. Fairness is linked to motivation, and hence contributes to
productivity. Yet if a commitment to fairness is misinterpreted as a synonym for equality, it can blunt incentives.
Economists have long struggled with the concept of fairness. Equity is defined by different people in different ways, reflecting value judgements. From
utilitarianism to Rawls, a range of definitions serves every point on what maps onto the political spectrum. Many economists have given up thinking about
fairness and focused exclusively on efficiency – adopting by default a utilitarian approach that is itself value laden.
And therein lies the rub. What we are now learning from economic psychologists and behavioural economists is that people have a view of fairness that is
not served well by many existing economic models. Insights from experimental economics suggest that fairness – regardless of how woolly the definition of
that concept might be – is something that really matters to people, and it matters in ways that are not served well by existing models. Theultimatum game –
in which one player makes a proposal on how to share a given kitty with a second player, who must either accept or reject the proposal – is just one
example where experimental work shows that people simply do not behave in the ways that might be anticipated from a perspective where fairness does not
matter.
So if fairness matters to people, and all the evidence suggests that it does, then views of the world in which the focus of attention is purely on
increasing narrow economic goals are misplaced. A world of atomistic decision-makers concerned only with their own gain is not the world in which we live.
And that fundamentally challenges many of the assumptions upon which the scaffolding of our economic system is constructed.
Fairness is difficult to define, for sure, but employers that enshrine notions of fairness into their dealings with their workforce will ultimately find
themselves well placed. The challenge, of course, is that fairness is something that is measured across many dimensions – there are all sorts of ways in
which workers may deem their treatment unfair – and keeping tabs on all of them is not straightforward. Employing people is about so much more than the
challenge of setting a price to equate supply and demand.
The recession of the last few years has been remarkable not only for its severity, but also for the relatively modest increase in the overall unemployment
rate. But this has been achieved by employers offering workers fewer hours of work, and – in some industries in particular – with an increase in the amount
of unpaid overtime that workers are expected to supply. How workers will, over the longer term, adjust to what they perceive to be a quality of work
experience that is less than optimal is a matter of legitimate interest. Employers employ, and they have adjusted well to ensure that they could continue
to do so during the recent hard times. With the recovery comes a responsibility for them to employ well, and to employ fairly and this will be the focus of
two upcoming Work Foundation reports on low pay and productivity.
The UK's spatial housing market bubbles
28 March 2014
The Bank of England’s Financial Policy Committee has sounded a warning about conditions in the housing market. It notes a rise in mortgage approvals of
some 40% over the last year, and a record level of mortgages for which the loan is more than four times the borrower’s annual income. This warning reflects
more widespread concern about the emergence of a housing market bubble.
The latest data on house prices do indeed show a rapid acceleration, with average house prices across the country growing by some 6.8% over the year
January (with the Bank’s data suggesting a further sharp rise since). But this figure conceals some very substantial variations across the regions. In
London, house prices are growing at a rate of 13.2%, surely unsustainable. In the South East, the increase is 7.1%. In other regions the rate of growth is
much more modest – in the North East, house prices have grown by just 0.6%, and in Scotland by just 1.4%.
Regional unemployment disparities remain wide, with rates varying from 5.2% in the South East to 9.5% in the North East. Moreover, while unemployment is
falling quite rapidly in the South East, the latest data record a rise in the North West, Yorkshire and Humberside, the East of England, and the East
Midlands.
The latest available data on regional growth rates of gross value added – though somewhat out of date - likewise indicate a very uneven recovery. These
show the South East growing at 2.5%, but most other regions growing at less than 1% per year, and with the East Midlands actually contracting.
In sum, these data indicate a considerable measure of spatial disparity. Recovery is proceeding apace in the South East, but has barely begun in some other
regions. Past experience suggests that the improvement in the state of the economy will transmit across regions eventually – though it appears to be doing
so more slowly this time than it has done in the past.
The extent of the disparities at this juncture is, however, a little worrying. The boom in the South East needs to be checked, but without stalling growth
elsewhere. Monetary tools represent the mainstay of macroeconomic stabilisation policy, but a hike in the interest rate could not check growth in one
region without causing profound damage in others. Different conditions across space call for policies that have different impacts across space. The
solution to the South East housing bubble is not, therefore, to be found in macroeconomic policies – rather it is to address the supply side constraints.
That means, quite simply, building more homes.
The Director’s Report – March Issue
13 March 2014
Earlier this week, Mark Carney, Governor of the Bank of England, addressed the Treasury Select Committee to give evidence in connection with the Bank's
latest Quarterly Inflation Report. This report was published following a spate of economic good news stories - yet it remained downbeat. The unemployment
rate had fallen dramatically towards the 7% threshold that had been identified as the rate at which the Bank might consider tightening its monetary policy,
but there remains evidence of continued fragility in the labour market.
At the Select Committee, Dr Carney suggested that the equilibrium unemployment rate might now be around 6%, somewhat lower than he had thought a few months
earlier. With the actual unemployment rate now at 7.2%, that implies some slack. He added: 'We also have a degree of underemployment - people who want to
work full-time who are working on an involuntary basis part-time - one of the highest levels on record'.
This issue of underemployment is a key feature of the labour market after the Great Recession. Large numbers of workers are working shorter hours than they
would like to work, while some others are not working as much as they want. There is a clear misallocation of workers to work. And on balance, that
misallocation is very much in the direction of people being unable to access all the work that they would like.
For workers and their families, this situation merely serves to aggravate the difficulties that come from stagnant wages. Real wages have fallen, and,
while people seek to work longer hours to make up the shortfall, they find that they are not being offered as many hours as they are willing to supply.
This is a double-whammy.
Data on underemployment are collated by David Bell and David Blanchflower from the quarterly Labour Force Survey. They publish these data on their website,
and are now partnering with us to release the data on The Work Foundation's website on a regular basis, with commentary from staff at The Work Foundation.
The main Bell-Blanchflower index for quarter 3 of 2013 stands at 9.4%, well above the rate of unemployment of 7.6%. The net value of hours that people want
to, but cannot, work is tantamount to adding almost 2 percentage points onto the rate of unemployment.
Just to be clear - this is not an ordinary situation. Before the Great Recession, there was a pretty close balance between the number of extra hours that
underemployed people wanted to work and the number of excess hours that overemployed people wanted to shed. That is no longer the case. There is now a gap
of around 17.5 million hours per week between the two.
That represents a huge amount of underutilised labour. It also explains, in part, Mark Carney's caution about using the simple unemployment rate as a
measure of labour market slack or tightness. The economy may be healing, but there is still a long way to go. Moreover the path that the labour market is
taking as it heals is one that has different implications for different groups of workers - some of them pretty uncomfortable. Dr Carney has recognised the
importance of underemployment for macroeconomic policy, but it also has microeconomic importance. This calls on policy-makers to consider the new
challenges that are posed by the misallocation of hours and the adverse impact that has on many workers' lives.
Capacity constraints are softer than some would have us believe
05 March 2014
The size of the output gap is critical for determining the appropriate stance of fiscal policy, yet it has been the subject of considerable debate amongst
economists. Some new data from the Office for National Statistics provide some instructive information.
On every measure bar one (the exception being long term unemployment) the extent of spare capacity in the UK economy has narrowed over the last year.
Measures based on qualitative survey data from firms tend to suggest a narrower gap than do quantitative measures such as employment data. The qualitative
data are, by their very nature, harder to interpret; while they likely reflect practitioner perceptions quite accurately, it is difficult to explain why
they should differ so much from the quantitative indicators.
Of the latter, it is particularly noticeable that the proportion of part-time workers who are unable to find full-time work remains high - as does youth
unemployment. To the extent that such indicators reflect spare capacity in the labour market, the constraints (such as they are) appear more likely to be
related to capital. Given the low levels of investment in the UK economy in recent years, this should hardly be surprising. As, with the recovery,
investment picks up, so should capacity - this means that the potential level of output that is used in calculating the output gap is something of a
movable feast.
In a nutshell, the capacity constraints faced by the UK economy are much softer than some observers would have us believe.
Fixing the forecasts
12 February 2014
Economic forecasters have received a rough ride in the media, often for good reason. The Great Recession was not well predicted by many economists - though
there are some notable exceptions. In general GDP growth was overestimated both at the onset of the recession and over subsequent years - only more
recently, in the UK, have the forecasts (very markedly) underestimated the extent of growth.
The OECD has produced an evaluation of their own forecasts over this period. Two findings are of particular note. First, forecasts for economies that were
particularly open to external shocks were relatively prone to large errors. The impact of contagion of the financial crisis was underestimated. The global
interlinkage of financial markets is a feature of the microeconomy that macroeconomic models - even those (maybe particularly those) with strong
microfoundations - were not particularly well equipped to handle. This implies that forecasters need to learn a lesson about this aspect of their models
(and to some extent they have already done so).
Secondly, forecasts were unusually error prone in economies that, before the recession, had more rigid regulation in their product and labour markets. In
such economies, rigidities generate more extreme variations in employment and output than in economies where prices can bear the brunt of economic
fluctuations. The modelling of such impediments to the free movement of prices calls for quite detailed understanding of institutional arrangements within
the economies under study, and it is clear that this understanding needs to be improved if forecasters are to better their performance.
It should, however, be borne in mind that - while many observers like to judge economists on the basis of their forecasting ability - forecasting is far
from the be all and end all of economics. Understanding the past and present is arguably more instructive (and - given the uncertainties that the future
inevitably brings - more achievable) than accurately reading the statistical tea leaves.
Latest forecast for the UK economy
20 January 2014
The ITEM (Independent Treasury Economic Model) club (supported by Ernst and Young) have issued their latest forecast for the UK economy. They conclude that
growth in 2014 will accelerate to 2.7%, but caution that the recovery is very much led by consumer spending and that, until real wages rise, interest rates
should be held at their current low level.
It would be hard to disagree with the ITEM club - at least as a short term forecast. Their predictions for the years beyond 2014 show the characteristic
reversion to a steady state growth rate of around 2.5% that is characteristic of models of the type that they use - and recent experience suggests that we
should be sceptical of that.
But the note of caution that is sounded here, suggesting that the recovery is fragile while it remains so heavily dependent on consumer spending. If growth
does indeed accelerate to 2.7% this year, an outcome in 2015 of 2.4% (which is what the ITEM club is currently predicting) would be a rather better outcome
than I would expect.
March Director's report
17 March 2015
Much of the recent media commentary on technological progress foments fear. Barely a week passes without a new story about robots stealing our jobs. These
scaremongering stories miss the point that the nature of the work that we do has always evolved over time - our jobs will not be stolen, but they will
inevitably morph. For sure, our education and HR development systems need to be fleet of foot in order to react to the changing needs of the labour market.
But we should remember that, where they are adopted, new technologies will, generally speaking, come to the fore because they improve things for us. After
all, technological developments are human constructions; we have a choice.
Indeed, far from being a threat, the problem with technology in recent years - in the UK at least - has been that it has advanced far too slowly.
Between 2006 and 2011, the number of UK patent applications fell by some 15%. Over the same period, business enterprise investment in research and
development rose 9% from £16.4 billion to £17.8 billion (in 2012 prices); this followed a 3% real increase over the preceeding 5 years. While patent
numbers are a crude guide to the value of innovation, these data suggest something of a decline in the returns to investment in R&D. There is, of
course, a long literature, including the work of Zvi Griliches, Bronwyn Hall and others, pointing to a long term fall in the return to investment in
R&D in the US, and more recent studies have addressed similar issues in the UK, albeit for the period before the Great Recession. For the period
since, some evidence comes from NESTA's innovation index- which sums the percentage changes in all forms of private intangible capital and total factor
productivity. After a long period of growth, this fell by 2.0% in 2008 and by 6.8% in 2009, and has barely been positive since.
Business investment more generally has been identified by some observers as a key factor explaining the sluggishness of productivity. This is indeed likely
to be an important factor; from its peak in the second quarter of 2008, real terms business investment fell by almost 20% over the course of seven
quarters, and a subsequent partial recovery stalled in 2012. In late 2013 and early 2014 it recovered again, at one point rising at an annual rate of more
than 10%. But business investment has slid back over the last couple of quarters. The median forecast for business investment growth in 2015 now stands at
5.6% - down from the 2014 figure of 8.1%.
Measures designed to provide a healthy framework in which investment, and particularly successful investment in R&D, is encouraged include the
strengthening of patent protection and fostering of product market competition. Ensuring that firms with strong capacity to innovate have access to finance
is key, and promoting this is likely to require new instruments and methods for evaluating companies' stocks of intangibles.
While the productivity puzzle remains a conundrum largely because there is in truth a plethora of underlying causes, ensuring that the policy framework is
one that encourages successful innovation is likely to reap a high dividend in this arena. It is reassuring to note that this has come to be high on the
political agenda. For the longer term, as well as for fixing the short term issue, this will need to be a priority for the next government.
A bit more evidence on pay below the Living Wage
23 February 2015
The TUC has released an instructive analysis of low pay by locality, based on data from the House of Commons Library. The findings suggest that in some
areas more than half of all employees are being paid less than the Living Wage. These areas range from urban centres such as Birmingham Northfield and
Enfield Southgate to rural areas including Dwyfor Meirionnydd. At the opposite end of the scale, the proportion of employees paid less than the Living Wage
is just a little over 10% in several parts of London, but also in Dundee West and Cardiff North.
The Living Wage is an interesting metric, not least because it provides a rough and ready guide to the extent to which workers need support from the
welfare system in order to make ends meet. If there is a high proportion of workers not earning enough to meet basic needs, demands on the welfare state
are likely to be considerable, and consequently government will experience difficulty in making significant reductions in its own expenditure and so in
tackling the budget deficit.
This is just a rough metric, though. In practice it matters who is earning low pay. It may be young people working part-time while still in full-time
education; it may be adult workers with families to care for; it may be one, or it may be both, earners in a two income family. Unfortunately the TUC data,
based as they are on data from the Annual Survey of Hours and Earnings (ASHE), cannot provide much information about this.
Data from the Labour Force Survey (LFS) can, though. It should be emphasised that these data are not as comprehensive as the ASHE data for the
consideration of earnings, but the LFS data nevertheless provide some useful additional information. I have used the most recent available four quarters of
data in the analysis that follows - from 2013Q4 through 2014Q3.
In all, some 27.1% of 16-64 year olds in the LFS data were paid below the Living Wage. This figure is somewhat higher than the ASHE equivalent. This may be
due to differences in sampling or in the way the data are collected, but it should not unduly affect the relativities reported below.
To some extent, there is a concentration of low pay in the youth labour market. If we restrict the sample to those aged 25 or more, the proportion of those
earning less than the Living Wage falls to 23.0%.
Gender differences are marked. Some 32.8% of female 16-64 year olds are paid below the Living Wage, but the corresponding proportion for men is just 20.9%.
If we look just at workers who are not currently married, some 34.8% are paid below the Living Wage. For men who are not currently married, the proportion
is 30.3%.
In many respects, the most interesting group is those who are married. It is important to know the extent to which individuals with low pay tend to have
spouses who also have low pay. The greater the extent, the greater are the implications for poverty and the greater the implications for the welfare
system. Some 19.0% of married respondents with earning partners earn less than the Living Wage. There is a marked gender differential, with the proportions
being 25.9% and 12.2% for married women and married men respectively. Some 5.9% of households with married earners have both partners earning less than the
Living Wage – a much lower proportion than is observed for other groups.
These statistics are instructive in providing greater detail on the demography of low pay. The concentration of low earnings amongst those not currently
married - and in particular amongst women - should be a matter of concern.
The economic recovery, in terms of employment gains, has been impressive so far. While there has been some evidence in recent months of wage increases,
there has also been some evidence that the gains have been skewed, with those in the lower part of the income distribution gaining relatively little. Low
pay is obviously a problem for those who do not receive sufficient earnings to meet their basic needs. But it is also a much wider problem that is
affecting our ability to pay back the deficit. Putting in place the conditions for a productivity revival - encouraging investment in physical and human
capital, stimulating demand - should be the priority for the labour market over the coming months and years.
Director's February report
18 February 2015
One of the major research themes at The Work Foundation in recent years has focused on the issue of youth employment. Three years ago, the numbers of young
people (aged under 25) who were unemployed exceeded a million. This was profoundly harmful to the young people directly affected, of course, and moreover
it represented a huge wasted resource for the country as a whole.
Since then, youth unemployment has fallen along with the overall unemployment rate. The latest data indicate that some 763000 young people are unemployed.
This amounts to an unemployment rate of 16.8%, well above the 5.8% rate that attaches to the labour force as a whole.
The latest set of data on underemployment produced by Bell and Blanchflower - and published on The Work Foundation's website earlier this month - further
highlight the difficulties faced by young workers. Not only are young workers more prone to unemployment than are their older counterparts, but they are
also more prone to underemployment.
Taking the labour market as a whole in the UK, underemployment only became a noticeable feature during the Great Recession. Until 2007, the underemployment
rate tracked the unemployment rate quite closely. But then a gap of around 2 percentage points opened up, and this has started to close only in recent
months. For young workers, however, underemployment has been a feature for much longer. In 2001, the earliest period for which data are available, the gap
between the unemployment rate and the underemployment rate for this group amounted to 4 percentage points. This opened up to more than 9 percentage points
in 2013, and even now remains as high as 7.5 percentage points. This means that, the underemployment rate for young people in the UK currently stands at
some 24%. This is a huge underutilisation of talent.
The Prime Minister has laudably promised to 'end youth unemployment' in the next parliament. The data suggest that such a promise, welcome as it is, does
not go far enough.
The Bell and Blanchflower data throw light also on the incidence of unemployment and underemployment by ethnicity. Taken as a whole, the figures paint an
uncomforatble picture for young people. The unemployment and underemployment rates faced by young people from ethnic minorities - and especially by young
black people - are huge. The unemployment rate for this group remains above 30%. Once account is taken of workers who wish to work longer hours to
calculate an underemployment rate, the figure rises to well over 40%.
Education has long been promoted as a route to a better labour market experience. It certainly helps. But alone it is insufficient to close the gaps noted
above. As we argued in our written evidence to the Education Select Committee last year, young people should be protected from adverse labour market
conditions, and this requires construction of a new framework for the delivery of employment, skills and welfare to work schemes.
The youth labour market is far from fixed. At The Work Foundation we shall continue to conduct research in this important area, informing advice that can
help transform policy to the benefit of (what, given the extent of underemployment, we still consider to be) the missing million.
Young, gifted with underemployment, and black
04 February 2015
The latest release of underemployment data in the Bell-Blanchflower series has highlighted sharp differentials by age and by ethnicity in workers’
experience in the labour market. These differentials are explored further in the table below, which draws on pooled data from the most recent available
four quarters of the Labour Force Survey The unemployment rate for young people – those who have left full-time education and are aged under 25 – varies
markedly across ethnic groups. For all groups, however, the rate is well above the corresponding rate for the overall population of working age. The
unemployment rate is particularly high for young black workers. To some extent young people can mitigate the harsh environment of the labour market by
investing more heavily in their own education. Rates of unemployment are lower – and in the case of young black workers markedly so – for those who leave
education beyond the age of 18 than for those who leave earlier.
As is made clear in the Bell-Blanchflower data, the young suffer disproportionately from underemployment, with many young workers wishing to work longer
hours than they currently work. This is captured, albeit crudely, in the table by the second row of data – which shows what the unemployment rate would be
if we counted as unemployed all those who work part-time. The incidence of part-time working across all groups of young workers is huge. Again, young black
workers appear to be the most disadvantaged group.
Education certainly helps young people make their way in the labour market. But the data reported here suggest that a wider range of solutions are called
for in order to alleviate the wasted resource represented by young people.
The latest underemployment statistics from Bell Blanchflower
04 February 2015
The latest figures on the Bell and Blanchflower underemployment series have now been produced and are reported below. The underemployment rate is
constructed by adding to the unemployment count a full-time equivalent of the net number of hours for which workers who are currently working fewer hours
than they would like to work are employed. Until 2008, the unemployment series and the underemployment series followed each other closely. Since then, the
rate of underemployment has been consistently above the rate of unemployment. This means that the unemployment rate is no longer a sufficient measure by
which to judge the extent of slack in the labour market.
The figures for the third quarter of 2014 show that, as unemployment has fallen, so too has the underemployment measure. While the gap between the two
rates amounted to more than 2 percentage points in the first quarter of 2013, it is now reduced to a little under 1.5 percentage points. This suggests that
the labour market is returning to normality - but slowly; the unutilised supply of labour is still markedly greater than the relatively low rate of
unemployment might suggest.
There are interesting differences by gender, age and ethnicity. While the unemployment rate is slightly lower for women than for men, the underemployment
rate for women is higher. This suggests that women are particularly likely to be working part-time when they would like to work longer hours.
Amongst young people, rates of unemployment are high - currently just above 15 per cent. But this group is particularly prone to underemployment - the
underemployment rate is almost 24 per cent. At the Work Foundation, we have often spoken of the 'missing million' young workers - with many working
part-time, it is no longer the case that a million young individuals are without work, but the full-time equivalent level of workkessness amongst this
group still amounts to well over a million. This resource has the potential to deliver huge output gains for the economy.
Rates of unemployment are particularly high for young people in ethnic minorities, and, amongst these, particularly so for black youths. There was,
however, a particularly marked fall in the unemployment rate for this group over the first three quarters of last year. But that fall has been accompanied
by only a very slight dip in underemployment. The good news that these workers are finding jobs has to be tempered by the fact that many of them are
looking to work longer hours.
Looking at ethnic minority workers across all age groups, both unemployment and underemployment rates are higher than for white workers. Indeed the
underemployment rate for black workers remains above 20 per cent - though the unemployment rate is a little under 15 per cent.
In sum, the new data provide some encouragement that the labour market is moving in the right direction. The gap between unemployment and underemployment
rates is getting smaller as the economy returns to health, but it is still substantial, and it would be rash to use the unemployment rate alone as a
measure of labour market tightness.
Director's January report
20 January 2015
At the start of a new year, we are all tempted to ask the question: what will the next 12 months bring? So let me try and answer this from the point of
view of a commentator on the labour market in the UK. It’s an easy question to answer in a single word – uncertainty.
That answer is, of course, more than a bit of a cop-out. So let me spell out three areas where this uncertainty is likely to manifest itself.
First, the strength of the economic recovery and the consequent impact on the labour market is likely to depend crucially on developments in our major
trading partners. The recovery in mainland Europe remains weak, and this has already started to put a brake on recovery in the UK. GDP growth in 2015 is
likely to be slower than it was in 2014. How much slower is unclear at this point, however. A major source of uncertainty surrounds the possibility of
Greece leaving the Eurozone – the so-called ‘Grexit’. This has become an issue once again in the run-up to the Greek election on 25 January. When the
possibility of a Grexit was mooted a couple of years ago, the fear of contagion and a subsequent wider collapse of the Eurozone was acute. With interest
rate spreads now being more moderate, such contagion is less likely, but the impact of a Grexit could nonetheless be considerable. This is particularly the
case if the exit were accompanied, or quickly followed, by Greece defaulting on debt. Several of our major trading partners would be exposed in this
scenario and their growth prospects – and hence ours too – would be compromised.
Secondly, the UK’s own election in May will be one in which the policy offerings of the major parties will have distinct labour market effects. The parties
have stated their ambitions for narrowing the budget deficit. In so doing, they make very different assumptions about the way in which these aspirations
will affect economic growth. Take your pick: but whichever set of assumptions you go along with, there will be uncertainty about how growth – and hence the
labour market – will evolve over the coming period while we still do not know the outcome of the election. Moreover, on at least one scenario, further
uncertainty is provided by the possibility of another ‘rexit’ – the ‘Brexit’ – with the possibility of a referendum on British membership of the EU. Once
again you can take your pick about the assumptions you make about the likely labour market costs and benefits of a Brexit – but until you know the outcome
of the election and any referendum, uncertainty will prevail.
Thirdly, there is uncertainty about whether growth in productivity will be restored. Business investment increased healthily over much of 2014, and
ordinarily we would expect to see this reflected in productivity gains. That improvement in investment needs to be consolidated in 2015, however – and the
uncertainties in the environment may not help in this regard.
Even if productivity recovers strongly in 2015, it is not clear that this will translate into a sustained increase in real wages. While simple models
equate wages with marginal product, simple models sometimes fail to capture pertinent information. US evidence suggests that the link between productivity
and wages has broken down. If that is a result of the twin forces of global trade and technological developments, then we can expect to see such a
breakdown in the UK too. Increased productivity may turn out to be a necessary, but not a sufficient, condition for wage growth. It would be good news
indeed if the recent increase in real wages turned out to be sustainable – but whether or not it does still remains to be seen. It cannot simply be assumed
that pre-recession trends will be restored.
In light of all this uncertainty, decision makers in business and government need sound advice and regular updating. At The Work Foundation, we play our
role in this partly by disseminating our work through our newsletter. I hope you will find something useful here.
Rate of growth of weekly earnings now well above the rate of inflation
17 December 2014
The latest release of statistics on the labour market offer almost uniformly good news. Employment levels continued to rise, by 115,000, in the latest
quarter. Meanwhile unemployment fell by 63,000, with the headline rate of unemployment remaining at 6.0%.
The more detailed statistics suggest a continuing trend towards restoration of normality in the labour market. The number of employees in employment
increased by 165000, with a reduction of 29000 in self-employment. Amongst those who are self-employed, the number working part-time fell by 34000 while
the number working full-time rose slightly. Meanwhile the total number of people working full-time increased by 166000, and there was a reduction of 51000
in the number working part-time. This is all reassuring news. We have expressed concern in recent months about the high levels of insecurity that remain in
the labour market. While this is still a concern, the latest figures indicate that we are clearly moving in the right direction.
The employment gains have been particularly pronounced in the utilities, transport and storage, and arts and recreation. The sharpest quarter-on-quarter
change was in the North West, with an increase in employment of some 35000. This region has been performing exceptionally well of late; recent data on
gross value added for 2013 showed it to be (along with Wales) the fastest growing region at 3.4%. Meanwhile employment declined in the most recent quarter
in London and the South East – regions that have been seen as the engines of the recovery.
Arguably the most significant development this month has been the rise in the rate of growth of weekly earnings – up 1.8% on a year ago. This increase is
now well above the rate of price inflation. The increase has been particularly marked in finance and business services (3.0%), with earnings in the
construction industry also rising quickly (2.7%). The recovery in finance comes on the back of a steady increase over the last three months. In
manufacturing, however, the rate of growth of earnings has moderated somewhat, reflecting muted growth in the production sector.
Director's December Report
11 December 2014
The Chancellor’s Autumn Statement earlier this month set out plans for restoring budget balance by 2018-19. These are welcome not least because they have
stimulated debate across the political spectrum about how fast government should go in closing the deficit.
Economic policy both affects and responds to conditions in the broader environment. In 2007-08 public sector net borrowing amounted to only 2.7% of GDP. In
response to the recession it rose to 6.7% and then 10.2% in the following two years. Reversing this has proved to be difficult. After two years of
austerity, the rate at which inroads have been made into the deficit has slowed considerably. In many respects this was a good thing. The economy was
flatlining, and, with monetary policy already as relaxed as it could be, putting the brake on further fiscal tightening probably prevented a second
recession.
A good thing it may have been, but it was also largely accidental. Receipts from taxation have been lower than might have been expected at this stage in
the cycle, and government expenditures have been higher. The reason for this is that the recovery has taken on a peculiar form. Over a million more people
are in employment now than four years ago, and there are more than half a million fewer people unemployed. But the recovery has not been as remunerative
for the Treasury as has been the case in the past, with real wages falling for many years after the trough of the recession. With many new jobs paying
wages in the space between the national minimum wage and the Living Wage, tax receipts from the extra income have been limited, and the government has
needed to pay out additional in-work benefits.
The preponderance of jobs at this end of the wage distribution is due to many factors. The supply of labour is buoyed by the implications of ageing and the
abandonment of a default retirement age, and also by immigration. Global competition and technology both have adverse implications for the demand for
workers of intermediate skill, as witnessed by the ‘hollowing out’ of the labour market. The key issue, however, relates to the primary determinant of real
wages, namely productivity.
Productivity has stagnated in recent years. There are many reasons for this – and we have explored these in depth at the Work Foundation. There is,
however, nothing inevitable about the productivity puzzle. In the US, productivity continued to rise steadily through and beyond the recession years.
The predictions made in the Autumn Statement assume that productivity will rise, bringing about an increase in real wages and hence in consumer spending.
If these predictions turn out to be ill-founded, the target of closing the budget deficit within a few years will be unrealisable. That being the case, one
might have expected more focus in the Statement on how business investment can be supported in ways that enhance productivity.
But of course, enhancing productivity is something that is in businesses’ own interests too. As changes in the world around us redefine how various tasks
are undertaken, so businesses need to undergo a zero-based rethink of the ways in which jobs are configured. How can tomorrow’s jobs best be constructed,
from scratch if need be, so that they use workers’ skills to full effect, and provide workers with career structures, progression, and growth? If employers
could answer that question, they could enhance productivity in their own organisations, offer increased living standards for their workers… and solve the
government’s problems with the public finances.
Autumn Statement lacks a clear vision of the route ahead
03 December 2014
Today’s Autumn Statement tells us something about the way in which the government sees the economy moving over the next few years, and rather less about
how it plans further to reduce the budget deficit.
After peaking at 3% this year, GDP growth is expected to fall to 2.4% in 2015. That is no surprise – indeed I have been predicting a slowdown next year for
some time, and the sluggish performance of the UK’s major trading partners in recent months reinforces the view that broader economic conditions do not
offer a favourable wind. The longer term projections for growth are for it to stabilise at between 2.2 and 2.4 per cent each year to the end of the decade.
This probably has more to do with the structure of the econometric models used in forecasting – which tend to revert to a mean – than any serious
assessment of the economics. We might be so fortunate, but equally we might, post-recession, be in a new world in which the secular rate of growth is
slower than it was before.
The public finances are forecast to improve dramatically beyond the current year. Last year’s outturn was a deficit of £97.5 billion. This year’s is
expected to be slightly lower, at £91.3 billion (down from £133.9 in 2010-11). But by 2016-17 it is expected to be only £40.9 billion, and the following
year just £14.5 billion. In percentage terms – as a percentage of GDP, that is – the deficit is expected to be 5.0% in the current year compared with 8.4%
in 2010-11. It is coming down, but slowly. If the recent strength of the economy were to be maintained, there may be scope for tightening the belt – but
many indicators suggest that this year’s strong performance has been a blip, and the Prime Minister may well be right to suggest that ‘red warning lights
are once again flashing’ in the economies of some of our major partners. In any event, the Autumn Statement provides little information about how the
turnaround that is still sought in the public finances is to be achieved, not least because the changes in planned expenditures and revenues announced
today imply only a small net gain.
Big money changes include an increase in personal tax allowances, a major reform of stamp duty (moving to a marginal rate system), a restriction on tax
relief that banks can claim on losses made in the aftermath of the financial crisis, and new employer contribution rates for public sector pensions.
Moreover, a scheme will be introduced to tax multinational enterprises that seek to declare profits overseas rather than face UK tax; how this will be
implemented is unclear.
Certain items of specific public sector investment are worthy of note – the Sir Henry Royce Institute for advanced materials will attract £235m in
Manchester, and a Big Data centre at Daresbury will attract £113m. These are significant investments in the North West – though the Alan Turing Centre on
Big Data will be located in London (which some may see as perverse given his connection with Manchester). Further investment in the Northern Powerhouse
includes infrastructure improvement, including road improvements in Merseyside and on trans-Pennine routes, HS3, and investment in other rail services.
While the Chancellor announced several public investment projects, the Statement is disappointingly thin on measures to promote business investment. There
are minor changes to R&D credits, and proposals to extend the work of the British Business Bank, notably through an extra £400m under the
Enterprise Capital Funds programme.
On the labour market, there are proposals to extend the National Insurance break for firms employing young workers to cover all workers under the age of 25
on apprenticeship schemes. While it is good to see the importance of youth training acknowledged, it is not clear that this is the best way to achieve
progress in this area. The quality of many apprenticeship schemes remains an issue, and it is in any event not clear that incentives of this kind are
efficient in view of the deadweight associated with providing a break to employers that would in any event have provided the training.
A particularly welcome innovation is the proposal for a loan scheme to finance taught postgraduate education. This will help end the current inequity that
has made tuition at this level affordable (more or less) only to those with private resources.
Overall, the Statement is one with much detail to be pored over, but lacking a clear vision of the route ahead. The cuts that remain to be made in public
spending are severe, and we still await information on where the axe is intended to fall.
Underemployment figures show labour market slack remains
25 November 2014
In recent months, we have published a regular series of data on underemployment in the UK - the Bell Blanchflower Index. These data have suggested that the
extent of underemployment rose markedly during the recession and has remained substantial since.
Now the Office for National Statistics (ONS) has released further information on the extent of underemployment. Around 10 per cent of workers employed in
the UK are working fewer hours than they want. This rises to about 20 per cent for those working in elementary occupations; there is also very significant
underemployment in the sales and customer service occupations and in caring, leisure and other services. For those who are underemployed, the average
extent of underemployment is staggering - some 11.3 hours per week. Clearly many workers who would like to work full-time have access only to part-time
work.
Underemployment is not a phenomenon confined to employees - self-employed workers may also be able to work fewer hours than they would like. The extent of
underemployment amongst this group increased particularly sharply with the recession. While, at the beginning of the last decade, underemployment amongst
the self-employed was around 2 percentage points lower than that amongst employees, the two groups now have virtually identical rates of underemployment.
This reinforces the view that much of the growth in self-employment since the recession has been linked to increasing insecurity in the labour market, the
position of many of the new self-employed being somewhat tenuous.
There is relatively little regional variation in the incidence of underemployment. It is highest in the North East, at 11.5%, and lowest in the East of
England, at 9.2%.
The ONS data also provide information about overemployment - people who would like to work fewer hours than they do. Around 10 per cent of workers fall
into this category, with concentrations in managerial and professional occupations. Health professionals, senior businesspersons (such as CEOs), and senior
officers in protective services (including defence) are particularly affected.
The net level of underemployment (that is, underemployment minus overemployment) amounts to around 900,000 hours per week. This is tantamount to about one
percentage point extra on the unemployment rate. While this figure is somewhat lower than the Bell Blanchflower estimate (largely because ONS use a more
restrictive definition of underemployment), it confirms what we have known for some time: the unemployment rate is no longer a sufficient measure of labour
market slack, and there remains scope for the labour market to improve further without generating significant wage pressure.
The minimum wage and young workers
19 November 2014
New data have been published today on the incidence of low pay. The figures come from the Annual Survey of Hours and Earnings and refer to April of each
year. Four distinct levels of the national minmum wage are relevant: apprentices in their first year and those aged 16-18 had a minimum wage of £2.68 per
hour; for other workers aged 16-17 the minimum wage was £3.72; workers aged 18-20 had a minimum wage of £5.03; and for all other workers the minimum wage
was £6.31.
The data show that the proportions of workers being paid less than the relevant minimum wage is markedly higher for young workers (aged 16-20) than is the
case for those aged 21 or more. For the latter group, well under 1% are paid below the minimum, but for younger employees the proportion is between 2.5 and
3%. In total, some 236000 workers receive a wage below the minimum, of whom 40000 are aged between 16 and 20.
This is, in part at least, due to the incidence of part-time employment amongst young workers, many of whom are still in education. Part-time employees are
much more likely than full-time workers to be paid low wages.
There is some regional variation in the incidence of very low pay - it is lowest in London, the South East and Scotland, and highest (by far) in Northern
Ireland. For the most part employers show a good understanding of the requirements associated with minimum wage legislation. It may be that there is work
still to be done in ensuring that they respond quickly enough to workers' changing minimum wage rates as the employees pass key birthdays or as they
graduate from apprentice status. It may also be that there is work still to be done in communicating effectively to employers their responsibilities to
younger workers.
More generally, there is a need for employers - and for society in general - to nurture younger workers, providing them with jobs that offer a genuine
career path with the promise of development and progression. At The Work Foundation we have undertaken a considerable amount of research in this area, a
useful summary of which appears here .
The latest quarterly data from the Bell-Blanchflower underemployment index
13 November 2014
The Labour Force Survey for the second quarter of 2014 is now available and allows computation of the Bell-Blanchflower underemployment measure for this
period. The time series for this variable, along with comparable data for the unemployment rate, is given in the table and graph below. In these data, the
underemployment rate is directly comparable to the unemployment rate – it adds to the unemployment rate the full-time equivalent net effect of hours that
workers would like to work but cannot. Since the second quarter of 2007, the underemployment rate has been persistently above the unemployment rate. The
gap widened quickly, and by the end of 2009 was almost 2 percentage points. It remained stubbornly at about this level – although it has reduced slightly
over recent quarters.
The gap between the underemployment rate and the unemployment rate is important. It represents slack that still exists in the labour market despite the
impression that might be given by a relatively low rate of unemployment. People who are in part-time work and who want to increase their hours of work can,
as the economy recovers, switch to full-time work. The most recent evidence suggests that an increasing proportion of the new jobs that are being created
are full-time. If this trend continues, then we should expect the gap between the unemployment rate and the underemployment rate to narrow, and the
unemployment rate will once again become an appropriate measure of labour market slack. In the meantime, there is still reason to suppose that unemployment
can fall further without adding substantively to wage pressure.
The overall economic situation is evolving quickly, but there would appear, on the basis of the evidence presented here, to be little reason to countenance
a tightening of policy over the coming few months. The international evidence suggests that the UK has been quite unusual in the extent of underemployment.
Data from Eurostat indicate that – aside from Spain, Cyprus and Ireland, the UK is the country with the highest incidence of part-time workers who are
underemployed. The reasons for this are as yet not well understood, but what is clear is that the old models in which the unemployment rate alone sufficed
as a measure of labour market tightness are no longer adequate.
November Director's Report
11 November 2014
Low pay is in the news. Between 2010 and 2013, the hourly pay of full-time men at the bottom decile of the wage distribution rose from £7.20 to £7.50 – an
increase of some 4.2%. The corresponding figures for women were £6.72 and £7.00 – also representing a 4.2% increase. But over the same period, prices rose
by more than 10%, implying a fall of around 6% in real pay.
In 2013, the Living Wage – which measures the wage deemed necessary for a full-time worker to cover the cost of necessities - was £7.45 per hour outside
London and £8.55 in the capital. It is clear that many full-time workers are being paid less than this basic level. This imposes strain on workers, their
families and communities. It imposes strain also on the public finances as welfare payments support those who could not otherwise make ends meet. It is
opportune therefore to ask what can be done to promote – and justify – higher pay.
Before answering that question, it is important to consider some of the factors that have brought us to the current situation. It is now almost 20 years
since Richard Freeman asked whether our wages are set in Beijing. His point was that global competition in traded goods and services puts downward pressure
on firms’ costs, including wages. This tendency has been exacerbated by the skill-biased nature of technical change, with technology becoming increasingly
complementary to the input of some workers but increasingly a substitute for tasks performed by others. The consequent ‘ hollowing-out’of the labour market
has since been well documented. Over the years since the Great Recession, labour productivity has stagnated . This reflects partly the mix of jobs
available – the productivity of some workers being constrained by the jobs they do – but it also reflects a marked decline in productivitywithin
occupations.
The Work Foundation’s recent report on low pay describes the problem in some detail, and makes recommendations for action by policy-makers and
practitioners. These include the development of new career ladders that are not locked into old patterns but that recognise the constraints and
opportunities offered by technological developments. They include also recommendations on the role that should be played by Local Enterprise Partnerships
and sector organisations in supporting business through times of rapid change in the labour market. Further recommendations concern the remit of the Low
Pay Commission and the role that should be played by the Living Wage in future policy.
It’s not enough though. More work is needed to support businesses and policy-makers in providing a framework that can support a sustained increase in
productivity and pay. At The Work Foundation, we will do our part by continuing to produce research in this area – indeed we are currently entering a new
phase of work. If you would like to know more about this, do please get in touch.
Will devolving powers to Manchester really stimulate economic development?
03 November 2014
The Chancellor of the Exchequer has announced that new powers are to be devolved to the Greater Manchester Combined Authority (GMCA). The GMCA will gain
powers in the areas of policing, planning, transport and housing, and will be required to introduce the post of a directly elected mayor.
These powers are modest and do not offer the promise of any real capability to stimulate economic development. If the north of England is to be able to
position itself as more power is devolved to Scotland and other regions, it will itself need further dicretionary powers.
But the absence of such powers in the current proposals might in fact be a blessing.
For while this move is being portrayed as progress in the development of the Northern Powerhouse, it is not at all clear that it represents a positive
development in that context. The Northern Powerhouse is intended to create a single urban area stretching across the Pennines, bringing in Leeds and
Sheffield as well as Manchester - and reaching out further in both directions along the M62 corridor. Creation of a nexus of political authority in
Manchester may well hinder economic integration of the north rather than aid it.
Northern cities face a drain of human capital to London and they lack the capital's levels of business investment. The disadvantage faced by the north thus
amounts to much more than the lack of a high speed rail link over the Pennines. Integration requires a unified political purpose that is not well served by
creating divisions now between Greater Manchester and weaker local authorities elsewhere.
Creating new jurisdications in a UK that is characterised by devolved government requires careful thought. It should not come about purely as a consequence
of 10 local authorities deciding to work together. Wider interests are at stake, and central government has a duty to take those fully into consideration.
Should Manchester be a metro in its own right? What then of the Northern Powerhouse? So should the metro include Liverpool, Leeds and Sheffield? Maybe. But
what then of Newcastle? And what of the rural areas in between? These are questions worthy of debate. Computable general equilibrium models are used to
evaluate such issues elsewhere. Serious research is needed in the UK too.
Today's first step is not altogether promising.
October Director's blog
14 October 2014
The performance of the UK economy over the last year has been remarkable. Output has increased by over 3 per cent. The unemployment rate, which had
previously been stuck at just under 8 per cent for a long time, has fallen dramatically and now stands at 6 per cent. The benefits of this fall have been
felt by people across the country and in all demographic groups.
There nevertheless remains a curious sense of unease about the performance of the labour market. Productivity has continued to stagnate, and this has meant
that increases in wages have not been able to keep pace with price rises. People in work might wonder why they don't feel better off than a while back -
and the simple answer is: it's because they aren't.
Over the last few months, however, there has been a dramatic turnaround in the level ofbusiness investment. The latest figures suggest a year on year
increase of more than 10 per cent. This should mean that workers have better equipment with which to work. Whether or not they do, of course, depends on
what lies beneath the aggregate figures. But if they do, then we should, within the next year, start to see productivity grow once more. That would at last
bring about a renewed increase in real wages.
Increased investment should also serve to ease capacity constraints, hence allowing further growth. While a low unemployment rate might ordinarily indicate
that there are capacity constraints arising also from a limited workforce, that is unlikely to be the case at present. Underemployment - where many people
are working fewer hours than they would like - and a high incidence of (what appears to be involuntary) self-employment both suggest that there is room for
further growth in the number of hours worked. To be sure, in some sectors - particularly advanced manufacturing - there are emerging signs of skills
shortages and rising real wages, but this is very much the exception rather than the rule. There remains considerable slack in the labour market, and, this
being the case, there is no sign yet of inflationary pressure. A reasonable estimate of the ‘natural rate’ of unemployment on the basis of recent years’
data suggests that unemployment could fall to as low as, or even slightly below, 4 per cent before inflation kicks in.
The remarkable growth that we have seen in recent months should not, however, blind us to the fact that it is remarkable. Looking forward to 2015, it would
be surprising if output were to continue to grow at the present rate. Growth in our major export economies remains sluggish, and exchange rate movements
over the last year are not helpful. As the EEF has recently cautioned, the outlook for demand is less certain now than it has been for while. Indeed, the
latest data on industrial production suggests that – in the production industries – growth has stalled. The economy overall should continue to grow next
year, but at a slower pace than we have seen in recent months.
Migration and the labour market
30 September 2014
The CIPD has today (30 September 2014) published a landmark study on the growth of migration to the UK from other parts of the EU. Migration is an emotive
subject, and the report is likely to attract widespread attention. Based as it is on significant new research, it should serve to enrich the evidence base
upon which discussion takes place. It is therefore very welcome.
As a proportion of total employment, the number of non-UK born workers has risen steadily over time; now at around 15%, the percentage has doubled since
the late 1990s. Employment of non-UK born workers from the accession countries of eastern Europe shows a step change after 2004, when unrestricted
migration within the EU became possible for workers in these countries. These migrants have been disproportionately employed in low skill occupations - in
sharp contrast to migrants from western Europe and those from outside the EU that are subject to visa regulations. Hence they tend to be disproportionately
employed as cleaners, caretakers, catering assistants, and so on - typically jobs that are not directly customer facing and which do not demand strong
communication skills. But migrants from the EU are also disproportionately employed as accountants and IT specialists. So the picture is considerably more
nuanced than popular conceptions might suggest.
Many of the migrants from eastern Europe, in particular, are overqualified for the jobs that they are currently undertaking. Indeed, since 2007, most
migrants from these countries who have degrees have been employed in low skill work. There would appear to be significant scope for increasing productivity
within the UK economy simply by employing these migrants' skills to best advantage. It is important, however, to note that employers do not consider
migrants generally to be working below capacity within their current jobs. Facilitating job mobility amongst well qualified migrants thus offers the
promise of high returns.
Employers cite the main reasons for employing migrants to be availability, followed by their work ethic and the congruence of migrants' values with those
of the employing organisations. Some 26% of employers claim to have found difficulties in finding UK born workers to fill unskilled or semi-skilled jobs,
and 20% employ migrants because of the perception that they have a better work ethic than UK born workers. The attributes that employers particularly value
amongst migrants include their teamworking skills, their orientation to customer service, their conformity to what the organisation wants, and their
integrity.
While employers who employ migrant workers report a beneficial impact, those who do not employ migrants tend to report that they do not perceive a benefit.
This suggests that there are few spillovers. In particular, migration does not appear to be benefitting employers by pushing down the general level of
wages. Only 6% of employers claim that they would raise wages to fill posts were migrant workers not available.
Migration is not, in any large measure, displacing training. Employers who recruit migrant workers are more likely than other employers to be investing in
training and apprenticeships. To some extent, this results from a scale effect - larger employers are more likely to do employ migrants and more likely to
train.
There is a marked spatial difference in UK workers' attitudes to migrants - low skilled workers in London regard migrants more favourably than those
outside the capital. This may be related to the high stock of migrants in London - a case of familiarity breeding acceptance rather than contempt.
Meanwhile, there is concern that migrants who take on low skill work are competing with UK domiciled school leavers. This serves to focus attention on the
skills with which these school leavers are equipped. Over a third of 16 year old school leavers - and almost as many 17-18 year olds - are deemed to be
poorly or very poorly prepared for the world of work. Equipping them better is clearly a prerequisite for enabling them to compete effectively and secure
good jobs.
And this is the overall impression with which one is left after reading the report - migration is really a red herring. It is time for the debate to move
on to this: how can we best equip young people born and raised in the UK so that they can compete effectively in the labour market - without a need for
protectionism?
September Director's report
17 September 2014
As recently as two years ago, there were over a million young people, between the ages of 16 and 24, unemployed in the UK. The figure has fallen sharply as
the economy has recovered, and the latest figure is just under three quarters of a million. The problem of youth unemployment seems to be receding fast.
But the new generation of workers faces a labour market that is changing rapidly, one in which the sources of insecurity are many. Technological change is
leading to a redefinition of many jobs. Reports of robots stealing humans' employment are surely a case of sensationalism - after all, the humans are still
available to work. But the type of work that people are called upon to do is changing. Many observers have referred to a 'hollowing out' of the labour
market, or the development of an 'hourglass' labour market - one in which the demand for labour at the extremes of the skills distribution is buoyant, but
the demand for intermediate skills is stagnant.
Matching young people's skills and potential to the jobs that are available is made difficult when the distribution of these skills differs substantially
from the patterns of skills that are in demand. As the demand for skills evolves with the introduction of new technologies, so workers must be equipped to
complement these technologies to best effect. This means training and re-training through the life cycle - and a much more fluid relationship between
education, training and work than we have seen before. It also means that career structures within organisations need to be dismantled and redesigned so
that progression remains possible. Young people need to develop their abilities in ways that enable them to contribute their utmost, and they need to know
that they can be rewarded with careers, not just jobs.
The Work Foundation will be hosting fringe events at party conferences over the next month. These events, 'More than a job -creating career opportunities
for young people' will focus on the challenge of providing young people with careers that entail a process of skills development, productivity enhancement,
and progression. Put together, this amounts to a new covenant between society and our young people - one that protects them and nurtures their talents. If
we fail to achieve this, the long term outlook for our economy is one of stagnation, but if we succeed, the potential rewards are huge.
A recovery that is struggling to sustain itself
17 September 2014
Unemployment has continued to fall, with the rate now standing at 6.2% (compared with 6.4% in last month's statistics). The number of employees in
employment has risen by some 65000 over the last quarter. Almost half of this gain (some 30,000) is in part-time work, once again reinforcing concerns that
there remains a significant measure of underemployment. The numbers of part-time self-employed workers have also risen (by 17,000), but full-time
self-employment figures have fallen (by 13,000), emphasising the insecure nature of many of these jobs. Overall, while the continued fall in unemployment
is welcome, the impression given by these data is one of a recovery that is struggling to sustain itself.
At regional level, there have been marginal increases in the unemployment rate in the North East, the South West and in Wales. By some distance, this
leaves the North East (at 9.9%) the region with the highest unemployment rate.
Of those regions where the unemployment rate has fallen fastest, the fall has been especially pronounced in the North West, Yorkshire and Humberside, the
East Midlands, London and Scotland. The unemployment rate in Scotland, at 6%, is currently the lowest of any of the four home countries.
One reason why the rate at which unemployment might be slowing down is that it has fallen almost as far as it can go - in other words that capacity
constraints are starting to bite in the labour market. If that were the case, we would start to see skills shortages and consequently increasing earnings.
There have, to be sure, been some signs of this in some sectors, notably manufacturing, in recent months. But overall, the rate of growth of earnings
remains extremely muted. In July, the year on year growth in average weekly earnings amounted to just 0.7% - up from 0.6% the previous month but still a
long way short of the current rate of price inflation. Wage inflation remains relatively high in manufacturing (1.8%) though it is slowing. In
construction, wages rose by 4% year on year - and this sector will be an interesting one to watch over the coming months. But in services, which dominate
the UK economy, wage growth is still very sluggish indeed (0.3% overall), and wages are still falling in some sectors. While underemployment remains so
high, the evidence from earnings data is that we are still a long way short of capacity.
The resolution of the cost of living dilemma lies in boosting productivity. But this remains stubbornly sluggish. The large increase in business investment
over recent months should help restore productivity growth, so there is cause for some degree of optimism that real wage growth should reappear sometime in
the next year. But, as The Work Foundation's roundtable on productivity established, there are likely to be some deep-seated and long-lasting barriers to a
rapid recovery. Growth may continue, but it is likely to do so at a slower rate than in recent months, and it is clear the restoration of a fully normal
economy is going to be a long term project.
Education at a glance
09 September 2014
The OECD has published its annual review of education statistics, Education at a Glance. As ever, this provides a wealth of data that together contribute
to provide a fascinating insight into the world of education in developed countries.
The report raises concerns about changes in the extent of social mobility. Averaged across all countries in the report, upward mobility across generations
- measured by the proportion of a younger generation that is better educated than its forebears - is falling as new cohorts enter the labour market, and
downward mobility is increasing. The report describes this as a 'setback' though in truth it may just be an artefact of the data. At a time when a high
proportion of parents are well educated, it is naturally less possible for a high proportion of their children to be better educated than their parents.
Averaged across the countries in the sample, graduation from upper secondary level has continued to rise steadily over recent years, and has reached a high
of 84% in 2012. By way of contrast, the report finds that the graduation rate from tertiary education fell slightly in 2012; this result should however be
treated with considerable caution, since some countries (Luxembourg, Chile) with low rates entered the data only in 2012, while other data for this year
are not yet available for other countries (Australia, the UK) with high participation rates in higher education. Overall, the picture is one of continued
high and rising levels of enrolment in post-compulsory education.
This is unsurprising, since the incentives to participate in education remain very high. Averaging across the OECD countries, higher education graduates
earn around 60% more than upper secondary graduates - who in turn earn around a third more than lower secondary graduates. These proportions have remained
virtually unchanged over the last decade and a half at least. The distributions are somewhat more compressed in some northern European countries (notably
Sweden, Denmark and Estonia) but are remarkably consistent across the other countries in the data set.
While the concerns raised in the report about social mobility may overstate the extent to which younger generations are disadvantaging themselves by not
investing as much as their parents in education, the fact that education is a major driver of individual progress remains as true as ever.
Bridging the skills canyon
04 September 2014
Today (4th September) sees the launch of an important new report by the Centre for Cities and the Joseph Rowntree Foundation. The report concerns the role
that cities need to play over the coming years in providing individuals with a route out of low paid employment and into more productive and remunerative
work.
The squeezed middle of the skill distribution has received considerable attention of late. There is much evidence, in the new report and elsewhere, to
suggest that the demand for intermediate skills is falling in relation to that for skills at the top and bottom ends of the distribution. This has often
been put down to the effects of new technology. Robots can undertake many of the tasks that have been performed by workers of intermediate skills,
heretofore. Moreover, new technology could replace some functions of highly skilled workers, taking over the role of diagnosis from medical practitioners,
for example.
Carl Benedikt Frey and Michael Osborne at Oxford University have gone so far as to suggest that around 50% of current jobs could vanish over the next 20
years as a consequence of computerisation. This has, understandably enough, led to some hysteria. But the reality is that jobs are each made up of a number
of tasks; it is the tasks, not the jobs themselves, that are taken over by technology. As workers find technological solutions to make their jobs easier,
the technology takes on some of the burden of their work, but the humans turn their efforts to other tasks. Jobs don't vanish. They morph. And, even if a
job currently undertaken by a human were to vanish, that human would still be available to do other jobs.
The squeezed middle is nevertheless a real phenomenon, and we do face the danger that some people might get locked into low productivity, low pay work, and
that they might be unable to traverse the canyon that is emerging between such jobs and the high quality jobs that are well remunerated. It is crucial to
remember at this point that it is the demand for skills that is bifurcating, not the supply. Workers are as able to make incremental improvements to their
skill sets as they ever were. The gap between the low paid jobs and the well paid jobs should not be harder for them to bridge simply because the canyon is
wider - many of those in low skill work have skills that exceed those required to perform their jobs, and it should in principle be possible for them to
upskill and make the jump to a better quality job. In a world populated by baristas and bankers, many of those in low productivity occupations already have
the ability and many of the skills needed to undertake higher productivity work. Identifying those who can and investing in them offers the prospect of
huge returns.
There is, however, a great difference between what should be possible and what actually happens. Ensuring that as many workers as possible are empowered to
make the most of their abilities is going to be more crucial than ever to economic development. The reward is that, in this new world, relatively small
investments in skill development can lead to substantial changes in the qualitative nature of the jobs that (at least some) workers can do. These
investments are critical to the growth of productivity. By ensuring that the investments are made, cities, regions and the national economy stand to gain
much in terms of output growth.
Cities have a key role to play, not least because the skill sets required within one urban area can differ substantially from that needed in another. Fully
taking advantage of opportunities to enhance productivity requires a local steer. Ensuring that human resource development meets industry needs calls for
training that is led by business. Cities, employers, education providers and central government all need to work together to face the new challenges. In
focusing on the role played by cities, the new report admirably draws a road map that will be useful in tackling the challenges that lie ahead.
August Director's Report
13 August 2014
Over the last 30 years, life expectancy at birth in the UK has been increasing by 2½ years per decade. A boy born now can expect to live to the age of 79,
while a girl can expect to live to the age of 83. Moreover, the increase in life expectancy that we have seen in recent decades isexpected to continue, so
children born in 2030 will expect to live even longer than those born now.
The ageing of the population has clear implications for those who are of working age. To support themselves in retirement, people will have to save more
while they are working and they will have to work longer. Both of these solutions present challenges to individuals, employers and government.
The savings rate in the UK has remained stubbornly low in comparison with international peers. Many large employers have put in place a variety of schemes
– including share ownership schemes – that encourage their workers to save. But there remains a dearth of serious research that can inform us about how the
detailed design of such schemes serves to incentivise different patterns of individual and aggregate saving. Insights from behavioural economics are likely
to be useful here; in particular, the idea that small policy changes can ‘nudge’ people into behaving in radically different ways. At the Work Foundation,
we are planning to investigate these issues using the Lancaster Experimental Economics Laboratory (LexEL), and our intent is that the insights we gain from
this will be profitably put into practice in many organisations.
Longer working lives also have implications for organisations as they manage their human resources. Succession management, promotion structures, human
resource development, an increased demand for flexible working, and the management of capacity issues are all likely to be challenged by increased
longevity. The scale of change is likely to be accelerated by the move from defined benefit to defined contribution pensions, not least because the impact
of economic turbulence on pension pots has been adverse, leading many workers to delay their retirement. The extent to which employers have prepared
themselves for what is likely to be a very rapid change is unclear. More clear is the fact that, in the new world, they will need to learn best practice
from each other very quickly.
At The Work Foundation, we are developing a new programme of research on ageing. This will cover all of the above issues and more. If you are interested in
finding out more about our plans, please get in touch with me – I shall be most keen to hear from you.
July's Director's report
15 July 2014
Unemployment scars people. This has been known for a long time, as has the importance of this for macroeconomic policy. If, as a result of a temporary
downturn in the economy, more people become unemployed, then, as the economy recovers, these people will find it relatively difficult to regain employment.
That means that what ought to be just temporary blips in unemployment develop a more permanent component. This phenomenon is known as hysteresis.
Two recent events at The Work Foundation have thrown the question of unemployment hysteresis into sharp relief. The first was the launch of our new report,
‘Sick of Being Unemployed’. This investigates the interplay between episodes of unemployment and ill health amongst men. Unemployment is a stressful
experience, and it is perhaps not surprising that it can lead to mental health problems. It can also, in consequence, result in behaviours that lead to
physical health problems – illnesses associated with smoking, drinking, or a sedentary lifestyle. Once their health suffers, the unemployed face a double
whammy – sick unemployed people are particularly unlikely to find their way back into work. So unemployment becomes hysteretic. Our report focuses on men,
because the evidence suggests that men are less capable than women in coping with unemployment – or at least they are less able to insulate health from
their labour market misfortunes. Managing the return to work for men who have suffered ill health is particularly important because work can contribute to
their recovery. At the macroeconomic level, if we can manage more people back into work, we can both raise output in the short term and break the vicious
circle that hysteresis represents.
Some (relatively) good news is that the Great Recession (in the UK) did not result in a massive increase in overall unemployment. While this is reassuring
to some extent, when we drill down to more detailed figures, there remains cause for concern about the longer term legacy of the experience of the last few
years. Youth unemployment did rise markedly during the recession, resulting in over a million young people being out of work. We have analysed this
phenomenon in some detail at The Work Foundation.
The second of our recent events was a seminar on young people and the recovery. This included the presentation of a paper by Mark Bryan and Alberto Tumino
which documents the long term scarring effects of unemployment on young people. Particularly striking is the fact that the scarring appears to be deeper if
young people first enter the labour market during times of recession.
Does this mean that the damage is already done? Have we lost a generation of young people? Not necessarily. But it does mean that that generation will need
unusual support to help them face the challenge of first entering employment and then living up to their full potential.Apprenticeships help – but they
need both to target the right people and to provide continuing support. Monitoring, and responding effectively to the needs of, those currently in their
early to mid-twenties will be a crucial investment. The penalty for getting it wrong is unfulfilled lives and a huge loss of potential output.
June Director's Report
10 June 2014
The European elections last month pushed to the fore questions about migration. These were reinforced on polling day by the release of the latest
statistics on immigration. These showed that the number of work-related visas issued in the last year has risen by some 10% - the bulk of this increase
being in the skilled (tier 2) category. In the year ending March 2014, the total number of work-related visas issued was a little over 156,000. The
government's target of reducing immigration to the tens of thousands appears to be slipping further away.
That might not be a bad thing. People migrate because they can benefit from doing so. To an approximation, workers get paid in line with their
productivity. If their productivity is greater in one place than in another - perhaps because the equipment they have to work with is better, or because
other resources are better, or because they are better managed - then the output of Earth Inc. rises, and we all benefit from that.
Of course, the world is not really quite so simple. Rapid movements of population bring about pressure points. Public services may be strained if the size
of a local population is rising rapidly, and (leaving the economics aside for a moment) people take time to adjust to new environments and new neighbours.
Leaving economics even further behind, people seem to believe that migration is bad for the labour market prospects of people who were born here; others
suggest that it is bad for the public finances. These notions have been comprehensively debunked by many studies - see for example an early Work Foundation
study on labour market effects, and the recent OECD report on the tax and benefit implications. Despite the evidence, these issues seem to remain a concern
for many people.
At least some of the above issues mean that there is a need for managing migration, and that is exactly what the government's points system aims to do. For
sure the system could benefit from some tweaks - it is not easy for smaller firms to navigate, and larger firms face challenges over its impact on
intra-company transfers. But the underlying premise of the system seems sound.
The points system does not, of course, cover migrants from the European Union. Neither do the figures on visas reported above. While the policy position
with regard to European migrants stays as it is, policy concerning migration from outside the EU has to flex to accommodate changes in flows of European
migrants. This imposes an added layer of complexity.
Debates about migration tend to polarise, with one side arguing for open borders and the other for tight controls. This does not seem to be a very grown up
way of going about things. We know that there are benefits to migration, and presumably these decrease (at the margin) as migration increases. We know
there are, in the short term at least, costs. So it should be possible to inform the debate by forming an evidence-based view about the optimal rate of
migration.
Policy-makers who wish to show some leadership on this issue might want to consider developing proposals that are based on evidence. They would then likely
face the task of educating the electorate. But the benefits attached to getting this right - something that is unlikely to happen by accident - could be
considerable.
The productivity puzzle - real or imagined?
28 May 2014
The economic history of recent years has been quite remarkable in many dimensions. One of the most notable features has been the sharp decline and
subsequent stagnation of labour productivity. Between 2007 and 2009, output per worker fell by over 5%. Over the subsequent four years, it rose by just 1%.
Since, owing to advances in technology, productivity usually grows year on year, the full effect of this is that productivity is now almost 20% below the
long run trend.
These statistics make the recent recession very different from many other recessions, particularly those of the 1980s and 1990s, after which productivity
recovered quite quickly. The initial decline in productivity is likely the result of a fall in demand; but one would normally expect firms to adjust their
labour input in line with this fall, thereby raising productivity, quite quickly. The prolonged fall in productivity is thus something of a puzzle. It is
not easy to imagine why we should have stopped being as good at doing things as we once were.
This productivity puzzle was the theme of a recent roundtable held at The Work Foundation. The context was set in presentations by Jonathan Haskel and
Charles Levy, with subsequent discussion involving representatives from the Treasury, the Department for Business, Innovation and Skills, the Office of
National Statistics, the Bank of England, and several other key agencies. While it is fair to say that (unsurprisingly enough) the roundtable did not solve
the puzzle, it succeeded in identifying several issues that are likely to be key to a solution, and also identified a promising and important agenda for
further research.
Several partial candidate explanations for the apparent slowdown in productivity were identified. Amongst these were:
• Changes in the composition of industry, notably the decline of capital intensive, high productivity, extractive industries such as oil. This may be a
partial explanation, but we know that productivity has declined within a wide range of sectors, not just in some industries.
• A decline in successful innovation, particularly in industries such as pharmaceuticals. This may contribute to falling productivity in some industries,
but it cannot explain the drop in productivity in industries that are less sensitive to innovation.
• Change in the composition of investment, with much investment now taking the form of R&D, design, brand management, reputation, and software
development. Over the last 20 years, such ‘intangibles’ have come to represent a far greater proportion than before of the economy’s investment – up from
under 10% to some 35%. When firms invest in intangibles, they seem to be spending resource on workers’ pay without getting a return – the intangibles are
not (by and large) treated as an investment in the national accounts, and so national output is mismeasured. This would suggest that GDP is, in reality,
higher than official figures suggest, and that productivity has not really fallen (or at least not by as much as the published data would lead us to
believe). However, investment represents a relatively small portion of GDP, and the increase in (unmeasured) investment would need to be far larger than is
currently the case if it were to explain more than a small part of the apparent decline in productivity.
• A change in the capital:labour ratio brought about by lower real wages. As real wages fell during the recession, firms may have substituted labour for
capital, with the hiring of lower productivity workers becoming increasingly worthwhile. Certainly, investment in physical capital has fallen and has
failed (so far) to recover – though many observers expect a marked bounce-back this year. To the extent that this has led to a deterioration of the toolkit
with which workers can use to undertake their jobs, one would expect it to lead to declining productivity. But whether the fall in the relative price of
labour has been sufficient of a trigger to bring this about is moot – especially given that a change in investment needs to be sustained over several years
to have a marked effect on the total stock of capital.
• The hollowing out of the labour market – a process whereby technology has led to the erosion of opportunities for workers with intermediate level skills.
Employment gains in recent years have been concentrated in low skill sectors, including retail and hospitality, and this may explain in part the decline in
overall productivity aggregates. Yet we know that this cannot be the full story because productivity appears to have declined across the piece, not just in
some sectors.
• Underemployment is a phenomenon that has drawn much recent attention, with many workers now being employed for fewer hours than they would like. If the
decline in productivity manifested itself only as a fall in output per worker, this might provide a convincing explanation. However, we have also observed
a significant decline in output per hour worked. So underemployment does not appear to be the story.
• The increase in self-employment. We still know relatively little about the nature of the new cohorts of self-employed workers. If they are concentrated
in low productivity occupations, then the rising incidence of this category of work might play a part in explaining the decline in output per unit of
labour employed. The self-employed still constitute a relatively small part of the workforce, however, and they are likely therefore to provide only a
small part of an explanation. Moreover, the increase in the numbers of self-employed workers has accelerated sharply over the last twelve months, and of
course the fall in productivity predates that by several years.
• The operation of the financial sector. In the years leading up to the recession, banks may have supported the development of firms that are characterised
by relatively low productivity. Following the downturn, by the same token, they may have been unable to support firms whose productivity profile is better.
In this respect, we may now have inherited a stock of firms that is suboptimal.
This last point, in particular, has generated considerable discussion – given the role played by the financial sector in supporting businesses in all
industries, it is a candidate explanation that is likely to have affected firms right across the economy, and it does not rely on an heroic assessment of
the impact on the capital stock of a fairly small change in the relative price of labour. We know, from work done at the Bank of England (see especially
Chart 18) that most of the change in productivity over the last decade or so is due to change that has happened within firms – not between firms in
different sectors. So anything that can offer an explanation for declining output per worker (or per hour) that is not sector-specific has particular
appeal as a prospective explanation.
In light of the above, the roundtable agreed that an appropriate programme for further research in this area might profitably focus upon:
• Establishing a better understanding of the nature of the new cohorts of self-employed workers
• Evaluating the changing nature of investment in the modern economy, disaggregated into land, buildings, physical capital, intangibles etc.
• Exploring the nexus of links between the banking system, capital markets, ability to borrow, and new firm formation; assessing the potential for new
models of banking to deliver a stock of employers with optimal characteristics
• Evaluating the role played by uncertainty in the low rate of investment (and hence low productivity).
NEET hotspots – national improvement masks real issues for many places
22 May 2014
Today’s news on young people not in employment, education or training (NEETs) provides further encouraging news on the improvement of labour market
conditions. The overall number of NEETs in the UK has now fallen below a million. The (seasonally adjusted) fall of 61000 in the most recent quarter
follows a fall of 37000 in the last quarter of last year; the unadjusted fall in the most recent quarter is 94000, this figure being boosted by the large
numbers of young people who leave education after the summer period. The bulk of this fall in NEETs (some 53000 in England alone) is observed amongst 18-24
year old males.
The data also confirm some broader regional patterns that are emerging from the wider range of labour market data. In the North East, the numbers of NEETs
increased in the last quarter, bucking the trend observed elsewhere in the country. In some other regions that appear also to be struggling to secure the
benefits of the recovery, such as the East and West Midlands, and also the East of England, the fall in the number of NEETs is small. Other regions,
including London, the South West, the North West and Yorkshire and Humberside observed relatively large falls in NEETs – very welcome news. The fall in
Yorkshire and Humberside is particularly noteworthy, not least because this region contains some of the localities in which the NEET rate has been highest
amongst young people – the latest available sub-regional data indicate that Barnsley, Wakefield, Bradford and Hull all had rates above 20%. The Work
Foundation’s map of NEET incidence shows quite starkly how varied experience is across geographies, this no doubt reflecting how the recovery more
generally is impacting differentially across industries and across space.
‘Squeezed middle’ is a phrase used in various contexts – but the emerging evidence on the regional impact of the recovery seems to suggest that it is quite
an apt description of the geography of current economic experience, albeit with a squeeze also in the North East.
May Director's report
14 May 2014
There has been a lot of good news about the economy recently. Output is growing rapidly and has now (finally) almost climbed back to pre-recession levels.
Likewise there is much encouraging news in the labour market, with a rapid fall in unemployment over recent months. Meanwhile vacancies have been rising
steadily over the last two years.
In the first quarter of this year, notified vacancies stood at 611000 - over 100000 more than a year earlier. There has been a particularly sharp rise in
vacancies in industries employing highly skilled workers - including health, education, business services and (significantly) in science and technology.
This increased demand for skills has been reflected also in work by the UK Commission for Employment and Skills, who argue that skills shortages are
emerging in some sectors. We might expect such shortages to be reflected in rising wages - and indeed the year on year change in weekly earnings has now
started to rise more quickly, and is on the point of overtaking the rate of price inflation. In some industries - particularly in manufacturing - the rate
at which wages are rising does seem to indicate that employers are indeed starting to run up against skill shortatges.
Yet some observers argue that a sustained increase in real wages is unlikely. They point out that productivity has flatlined over an extended period, and
that gains in productivity are needed to drive real wage increases. They argue further that, in any event, the link between productivity and real wages may
be weaker than in the past - though economic theory suggests that such weakening would be anomalous. And they suggest that, with the rise in unemployment
during the recession being rather modest, unemployment is unlikely to fall enough with recovery to bring about serious wage pressures.
This may be the case. Or it may not. One thing that is clear from the recovery so far is that the world we now inhabit is very different from the one we
lived in before the recession. I have written in earlier director's reports on the appearance and stubborn persistence ofunderemployment and about the rise
of self-employment. These are indicative of continued labour market slack - yet other evidence is pointing to a market that, at least in some dimensions,
is getting increasingly tight.
Much discussion about the current state of the labour market emphasises the effect that changes in technology are having on the qualitative nature of the
demand for skills. These changes are those that appear to be hollowing out the labour market - reducing the demand for intermediate skills while raising
the demand for workers at the extremes of the skills distribution. In times of such rapid change, underemployment for some may well be accompanied by
skills shortages. If this is the world we are now in, then it calls for rapid adaptation - an education and training landscape that is characterised by
fleetness of foot. For all involved - workers, employers, and those responsible for the education system - that represents a considerable challenge.
What do the latest GDP figures tell us about growth?
29 April 2014
The latest data indicate that, in the first quarter of this year, GDP grew by 0.8%. This implies a very healthy 3.1% growth over the course of the last
year.
The performance across sectors is uneven, with particularly strong growth in manufacturing and in distribution. Manufacturing grew by 1.3% over the
quarter, and by 3.5% over the year. This is clearly good news in that it addresses concerns that the UK had, before the recession, become over-reliant on
services. Strong growth in manufacturing helps raises incomes, but with developments in technology making this sector increasingly capital-intensive, the
progress of the sector may not be reflected in such strong employment growth. The extent to which this concern is well founded will require monitoring as
the recovery progresses. The strength of recovery in the distribution sector (which includes, amongst other things, retail and wholesale industries)
reinforces the extent to which this has, at least until very recently, been a recovery led by consumer spending. Recent forecasts from, amongst others, the
EY ITEM group, suggest that investment is set to rise significantly this year; if it does, then that will strengthen the underpinnings of a recovery that
has, till now, been built on rather fragile foundations.
Other metrics of the recovery, including house price changes, suggest that experience across the regions is very patchy. Data on output growth by region
are produced with long lags and are not considered to be terribly reliable, but the evidence that this recovery is spatially uneven suggests that the very
encouraging aggregate statistics may serve to conceal what is, in reality, a much more nuanced picture. The data on underemployment released by The Work
Foundation likewise suggest that the impact of output growth on the labour market is very different to – and less comforting than - what we have
experienced in the past.
Nevertheless these most recent data offer much hope that the economy is indeed recovering.
The latest quarterly data from the Bell-Blanchflower underemployment index
29 April 2014
The latest BellBlanchflower data on underemployment, published here on The Work Foundation website today, provide a mixed picture of the current state of
the labour market in the UK. There is evidence of some improvement over the course of the second half of last year, and that improvement is very welcome.
Yet the data send a clear signal that the labour market in the aftermath of the Great Recession is a very different place to the labour market before.
The unemployment rate peaked in the last quarter of 2011, but the subsequent decline in unemployment was very slow - indeed it did not change at all in the
year to the second quarter of last year. In the second half of last year, however, the rate started to fall dramatically, and the most recent evidence is
that this fall has continued into the early part of 2014.
The rate of unemployment does not, however, reflect the experience of those workers who would like to work longer hours than their employers will hire them
for - that is , underemployment. The BellBlanchflower data adjust the unemployment rate statistics to allow for this underemployment. In the period before
the Great Recession there was very little underemployment, but that is not the case in the period since. Indeed, underemployment is tantamount to almost an
additional two percentage points on top of the official unemployment rate. We might see underemployment as a useful thing during the period of recession -
it may have served to spread the misery of the downturn more evenly than would have been achieved by having more people fully employed and more people
jobless. But the persistence of underemployment through the early stages of recovery suggests that the labour market has still not adjusted back to what we
once thought of as normality. In the most recent quarter for which we have data, the extent of underemployment rose slightly (though it had fallen slightly
in the previous quarter).
The detailed data produced by BellBlanchflower suggest that underemployment is a particular problem for young workers. A recently published report by The
Work Foundation analyses the spatial differences in youth unemployment, which are considerable. It will be instructive, in the coming months, to examine
further the spatial aspects of underemployment - something that we intend to do here.
There are indeed some very encouraging signs of recovery in the macroeconomy. What is clear, however, is that the nature of this recovery is more than
usually nuanced. The fact that the overall unemployment rate is falling is unambiguously good news, but it may be concealing experience that is not so
rosy. There is some evidence of fear leading to larger numbers of people working unpaid overtime, of a rising trend in self-employment where large numbers
opt for this path in the absence of other options, and of underemployment especially amongst the young. At The Work Foundation, we intend to continue our
research into these areas and to keep them at the forefront of the public debate.
Latest labour market statistics provides a dose of good news all around.
16 April 2014
This morning's release of the latest labour market statistics provides a dose of good news all around. The unemployment rate has fallen below 7%, and
earnings are rising at 1.9% over the year. The rate of earnings growth is particularly pronounced in manufacturing, where it is 2.8%, possibly reflecting
the onset of skills shortages. In finance and business services, meanwhile, earnings have grown at only 0.3%, possibly reflecting in part the decline of
bonuses.
The detailed data still paint a more nuanced picture. Take productivity as an example. Output per job rose by 1.3% over the year to quarter 4 in 2013. This
is a marked improvement on the 0.5% achieved the previous quarter, and certainly better than the declining productivity that was still being experienced in
the first quarter of last year. However, improvement in output per hour has been considerably less impressive. This was still falling as recently as the
third quarter of last year. The final quarter figures are a little more encouraging (suggesting 0.7% growth on a year earlier), but remain fairly muted.
Another aspect of the labour market which has been interesting in recent years is the dramatic rise of self-employment. Between December-February and the
previous quarter, self-employment rose by some 146000, and the total now stands at more than 4.5 million. The latest figure represents a 7.1% change over
the year. Self-employed workers now comprise 14.8% of the workforce. We know that much of the increase in self-employment has taken place amongst older
demographic groups, and it remains unclear how much of the rise is due to entrepreneurial development as opposed to people running out of labour market
options. Clearly more research is needed on this.
In sum, therefore, the statistics are encouraging. But the labour market is clearly changing rapidly, and an exclusive focus on the headline metrics risks
being more than usually misleading.
The Director's Report - April Issue
11 April 2014
A recent report from the CIPD and LUMS, with input from the Work Foundation, examines theChanging Contours of Fairness. In the workplace, what is perceived
to be fair or unfair is often the trigger for a whole variety of disputes and managerial headaches.
Fairness means different things in different contexts. A worker who perceives her own productivity to be greater than those of her peers might think that
it is unfair if they are paid as much as she is paid herself. The whole workforce of an organisation might perceive a below-inflation pay rise to be
unfair, in that it disadvantages them as a group relative to workers in other settings. Fairness is linked to motivation, and hence contributes to
productivity. Yet if a commitment to fairness is misinterpreted as a synonym for equality, it can blunt incentives.
Economists have long struggled with the concept of fairness. Equity is defined by different people in different ways, reflecting value judgements. From
utilitarianism to Rawls, a range of definitions serves every point on what maps onto the political spectrum. Many economists have given up thinking about
fairness and focused exclusively on efficiency – adopting by default a utilitarian approach that is itself value laden.
And therein lies the rub. What we are now learning from economic psychologists and behavioural economists is that people have a view of fairness that is
not served well by many existing economic models. Insights from experimental economics suggest that fairness – regardless of how woolly the definition of
that concept might be – is something that really matters to people, and it matters in ways that are not served well by existing models. Theultimatum game –
in which one player makes a proposal on how to share a given kitty with a second player, who must either accept or reject the proposal – is just one
example where experimental work shows that people simply do not behave in the ways that might be anticipated from a perspective where fairness does not
matter.
So if fairness matters to people, and all the evidence suggests that it does, then views of the world in which the focus of attention is purely on
increasing narrow economic goals are misplaced. A world of atomistic decision-makers concerned only with their own gain is not the world in which we live.
And that fundamentally challenges many of the assumptions upon which the scaffolding of our economic system is constructed.
Fairness is difficult to define, for sure, but employers that enshrine notions of fairness into their dealings with their workforce will ultimately find
themselves well placed. The challenge, of course, is that fairness is something that is measured across many dimensions – there are all sorts of ways in
which workers may deem their treatment unfair – and keeping tabs on all of them is not straightforward. Employing people is about so much more than the
challenge of setting a price to equate supply and demand.
The recession of the last few years has been remarkable not only for its severity, but also for the relatively modest increase in the overall unemployment
rate. But this has been achieved by employers offering workers fewer hours of work, and – in some industries in particular – with an increase in the amount
of unpaid overtime that workers are expected to supply. How workers will, over the longer term, adjust to what they perceive to be a quality of work
experience that is less than optimal is a matter of legitimate interest. Employers employ, and they have adjusted well to ensure that they could continue
to do so during the recent hard times. With the recovery comes a responsibility for them to employ well, and to employ fairly and this will be the focus of
two upcoming Work Foundation reports on low pay and productivity.
The UK's spatial housing market bubbles
28 March 2014
The Bank of England’s Financial Policy Committee has sounded a warning about conditions in the housing market. It notes a rise in mortgage approvals of
some 40% over the last year, and a record level of mortgages for which the loan is more than four times the borrower’s annual income. This warning reflects
more widespread concern about the emergence of a housing market bubble.
The latest data on house prices do indeed show a rapid acceleration, with average house prices across the country growing by some 6.8% over the year
January (with the Bank’s data suggesting a further sharp rise since). But this figure conceals some very substantial variations across the regions. In
London, house prices are growing at a rate of 13.2%, surely unsustainable. In the South East, the increase is 7.1%. In other regions the rate of growth is
much more modest – in the North East, house prices have grown by just 0.6%, and in Scotland by just 1.4%.
Regional unemployment disparities remain wide, with rates varying from 5.2% in the South East to 9.5% in the North East. Moreover, while unemployment is
falling quite rapidly in the South East, the latest data record a rise in the North West, Yorkshire and Humberside, the East of England, and the East
Midlands.
The latest available data on regional growth rates of gross value added – though somewhat out of date - likewise indicate a very uneven recovery. These
show the South East growing at 2.5%, but most other regions growing at less than 1% per year, and with the East Midlands actually contracting.
In sum, these data indicate a considerable measure of spatial disparity. Recovery is proceeding apace in the South East, but has barely begun in some other
regions. Past experience suggests that the improvement in the state of the economy will transmit across regions eventually – though it appears to be doing
so more slowly this time than it has done in the past.
The extent of the disparities at this juncture is, however, a little worrying. The boom in the South East needs to be checked, but without stalling growth
elsewhere. Monetary tools represent the mainstay of macroeconomic stabilisation policy, but a hike in the interest rate could not check growth in one
region without causing profound damage in others. Different conditions across space call for policies that have different impacts across space. The
solution to the South East housing bubble is not, therefore, to be found in macroeconomic policies – rather it is to address the supply side constraints.
That means, quite simply, building more homes.
The Director’s Report – March Issue
13 March 2014
Earlier this week, Mark Carney, Governor of the Bank of England, addressed the Treasury Select Committee to give evidence in connection with the Bank's
latest Quarterly Inflation Report. This report was published following a spate of economic good news stories - yet it remained downbeat. The unemployment
rate had fallen dramatically towards the 7% threshold that had been identified as the rate at which the Bank might consider tightening its monetary policy,
but there remains evidence of continued fragility in the labour market.
At the Select Committee, Dr Carney suggested that the equilibrium unemployment rate might now be around 6%, somewhat lower than he had thought a few months
earlier. With the actual unemployment rate now at 7.2%, that implies some slack. He added: 'We also have a degree of underemployment - people who want to
work full-time who are working on an involuntary basis part-time - one of the highest levels on record'.
This issue of underemployment is a key feature of the labour market after the Great Recession. Large numbers of workers are working shorter hours than they
would like to work, while some others are not working as much as they want. There is a clear misallocation of workers to work. And on balance, that
misallocation is very much in the direction of people being unable to access all the work that they would like.
For workers and their families, this situation merely serves to aggravate the difficulties that come from stagnant wages. Real wages have fallen, and,
while people seek to work longer hours to make up the shortfall, they find that they are not being offered as many hours as they are willing to supply.
This is a double-whammy.
Data on underemployment are collated by David Bell and David Blanchflower from the quarterly Labour Force Survey. They publish these data on their website,
and are now partnering with us to release the data on The Work Foundation's website on a regular basis, with commentary from staff at The Work Foundation.
The main Bell-Blanchflower index for quarter 3 of 2013 stands at 9.4%, well above the rate of unemployment of 7.6%. The net value of hours that people want
to, but cannot, work is tantamount to adding almost 2 percentage points onto the rate of unemployment.
Just to be clear - this is not an ordinary situation. Before the Great Recession, there was a pretty close balance between the number of extra hours that
underemployed people wanted to work and the number of excess hours that overemployed people wanted to shed. That is no longer the case. There is now a gap
of around 17.5 million hours per week between the two.
That represents a huge amount of underutilised labour. It also explains, in part, Mark Carney's caution about using the simple unemployment rate as a
measure of labour market slack or tightness. The economy may be healing, but there is still a long way to go. Moreover the path that the labour market is
taking as it heals is one that has different implications for different groups of workers - some of them pretty uncomfortable. Dr Carney has recognised the
importance of underemployment for macroeconomic policy, but it also has microeconomic importance. This calls on policy-makers to consider the new
challenges that are posed by the misallocation of hours and the adverse impact that has on many workers' lives.
Capacity constraints are softer than some would have us believe
05 March 2014
The size of the output gap is critical for determining the appropriate stance of fiscal policy, yet it has been the subject of considerable debate amongst
economists. Some new data from the Office for National Statistics provide some instructive information.
On every measure bar one (the exception being long term unemployment) the extent of spare capacity in the UK economy has narrowed over the last year.
Measures based on qualitative survey data from firms tend to suggest a narrower gap than do quantitative measures such as employment data. The qualitative
data are, by their very nature, harder to interpret; while they likely reflect practitioner perceptions quite accurately, it is difficult to explain why
they should differ so much from the quantitative indicators.
Of the latter, it is particularly noticeable that the proportion of part-time workers who are unable to find full-time work remains high - as does youth
unemployment. To the extent that such indicators reflect spare capacity in the labour market, the constraints (such as they are) appear more likely to be
related to capital. Given the low levels of investment in the UK economy in recent years, this should hardly be surprising. As, with the recovery,
investment picks up, so should capacity - this means that the potential level of output that is used in calculating the output gap is something of a
movable feast.
In a nutshell, the capacity constraints faced by the UK economy are much softer than some observers would have us believe.
Fixing the forecasts
12 February 2014
Economic forecasters have received a rough ride in the media, often for good reason. The Great Recession was not well predicted by many economists - though
there are some notable exceptions. In general GDP growth was overestimated both at the onset of the recession and over subsequent years - only more
recently, in the UK, have the forecasts (very markedly) underestimated the extent of growth.
The OECD has produced an evaluation of their own forecasts over this period. Two findings are of particular note. First, forecasts for economies that were
particularly open to external shocks were relatively prone to large errors. The impact of contagion of the financial crisis was underestimated. The global
interlinkage of financial markets is a feature of the microeconomy that macroeconomic models - even those (maybe particularly those) with strong
microfoundations - were not particularly well equipped to handle. This implies that forecasters need to learn a lesson about this aspect of their models
(and to some extent they have already done so).
Secondly, forecasts were unusually error prone in economies that, before the recession, had more rigid regulation in their product and labour markets. In
such economies, rigidities generate more extreme variations in employment and output than in economies where prices can bear the brunt of economic
fluctuations. The modelling of such impediments to the free movement of prices calls for quite detailed understanding of institutional arrangements within
the economies under study, and it is clear that this understanding needs to be improved if forecasters are to better their performance.
It should, however, be borne in mind that - while many observers like to judge economists on the basis of their forecasting ability - forecasting is far
from the be all and end all of economics. Understanding the past and present is arguably more instructive (and - given the uncertainties that the future
inevitably brings - more achievable) than accurately reading the statistical tea leaves.
Latest forecast for the UK economy
20 January 2014
The ITEM (Independent Treasury Economic Model) club (supported by Ernst and Young) have issued their latest forecast for the UK economy. They conclude that
growth in 2014 will accelerate to 2.7%, but caution that the recovery is very much led by consumer spending and that, until real wages rise, interest rates
should be held at their current low level.
It would be hard to disagree with the ITEM club - at least as a short term forecast. Their predictions for the years beyond 2014 show the characteristic
reversion to a steady state growth rate of around 2.5% that is characteristic of models of the type that they use - and recent experience suggests that we
should be sceptical of that.
But the note of caution that is sounded here, suggesting that the recovery is fragile while it remains so heavily dependent on consumer spending. If growth
does indeed accelerate to 2.7% this year, an outcome in 2015 of 2.4% (which is what the ITEM club is currently predicting) would be a rather better outcome
than I would expect.